Technical Analysis of PSTP 2024-05-10
Overview:
In analyzing the technical indicators for PSTP over the last 5 days, we will delve into the trend, momentum, volatility, and volume indicators to provide a comprehensive outlook on the possible stock price movement in the coming days. By examining these key aspects, we aim to offer valuable insights and predictions to guide your investment decisions.
Trend Indicators:
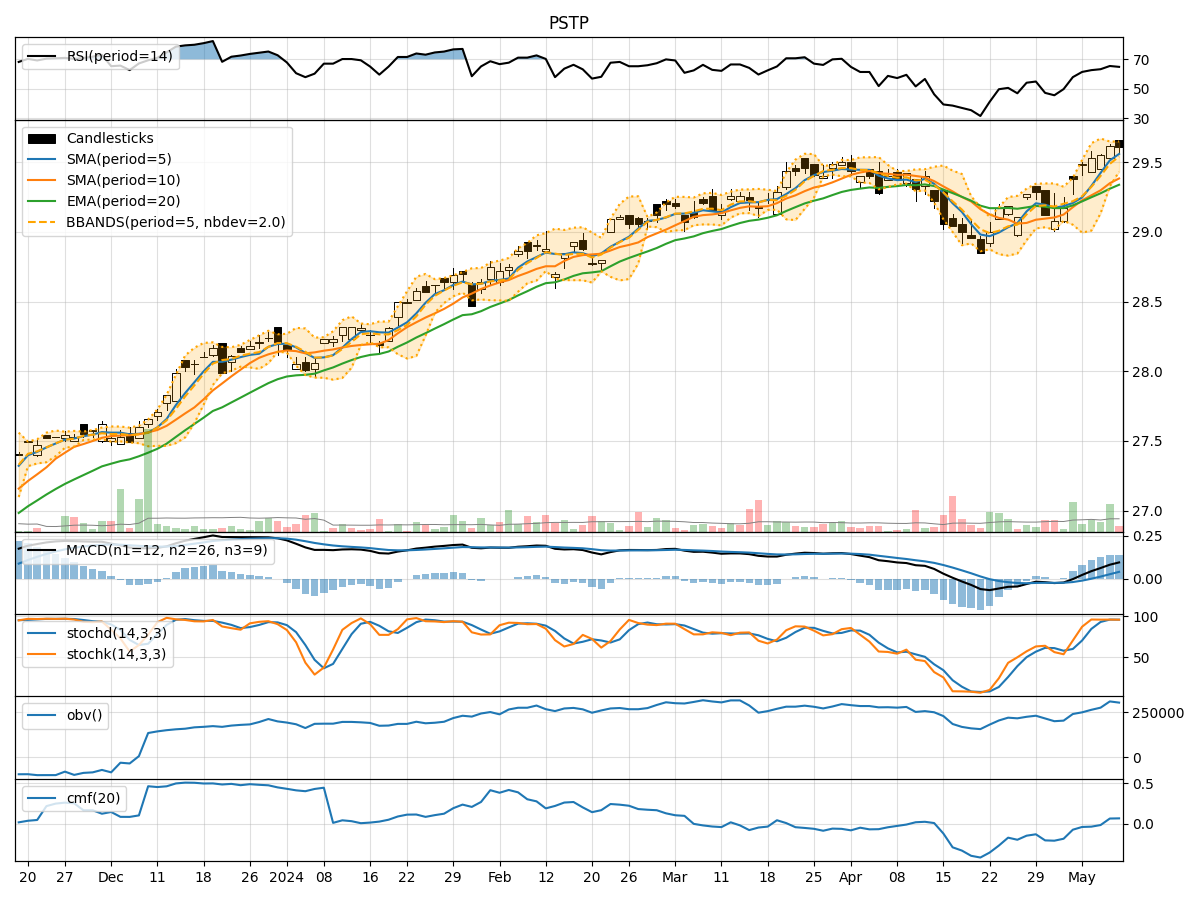
- Moving Averages (MA): The 5-day MA has been consistently above the 10-day SMA, indicating a short-term bullish trend. The EMA(20) has shown a gradual uptrend, suggesting positive momentum in the stock price.
- MACD: The MACD line has been above the signal line for the past 5 days, indicating bullish momentum. The MACD histogram has been steadily increasing, reflecting strengthening upward momentum.
Momentum Indicators:
- RSI: The RSI has been in the 60-70 range, indicating a moderate level of buying pressure. It has not reached overbought levels, suggesting room for further upside potential.
- Stochastic Oscillator: Both %K and %D lines have been consistently high, signaling strong bullish momentum. The stock is trading near the overbought territory, indicating a potential pullback.
Volatility Indicators:
- Bollinger Bands (BB): The stock price has been trading within the upper Bollinger Band, indicating an overbought condition. The bands are relatively narrow, suggesting a period of low volatility.
- Bollinger %B: The %B indicator is above 0.5, indicating that the stock price is closer to the upper band. This could signal a potential reversal or consolidation phase.
Volume Indicators:
- On-Balance Volume (OBV): The OBV has shown a positive trend, indicating accumulation by investors. This suggests that buying pressure has been increasing over the past 5 days.
- Chaikin Money Flow (CMF): The CMF has been slightly positive, indicating that money is flowing into the stock. However, the reading is not significantly high, suggesting cautious investor sentiment.
Conclusion:
Based on the analysis of the technical indicators, the stock price of PSTP is likely to experience a short-term pullback or consolidation in the coming days. While the trend indicators suggest a bullish bias, the momentum indicators point towards a potential reversal from overbought levels. The volatility indicators indicate a period of low volatility, which could precede a price correction. Therefore, investors should exercise caution and consider taking profits or waiting for a better entry point before initiating new positions.
In summary, the outlook for PSTP is cautiously bearish in the short term, with a possible sideways movement or minor correction expected. It is advisable to monitor key support levels and wait for clearer signals before making significant trading decisions.