Technical Analysis of PTEC 2024-05-10
Overview:
In analyzing the technical indicators for PTEC over the last 5 days, we will delve into the trends, momentum, volatility, and volume aspects to provide a comprehensive outlook on the possible stock price movement in the coming days. By examining key indicators such as moving averages, MACD, RSI, Bollinger Bands, and OBV, we aim to offer valuable insights and predictions for informed decision-making.
Trend Analysis:
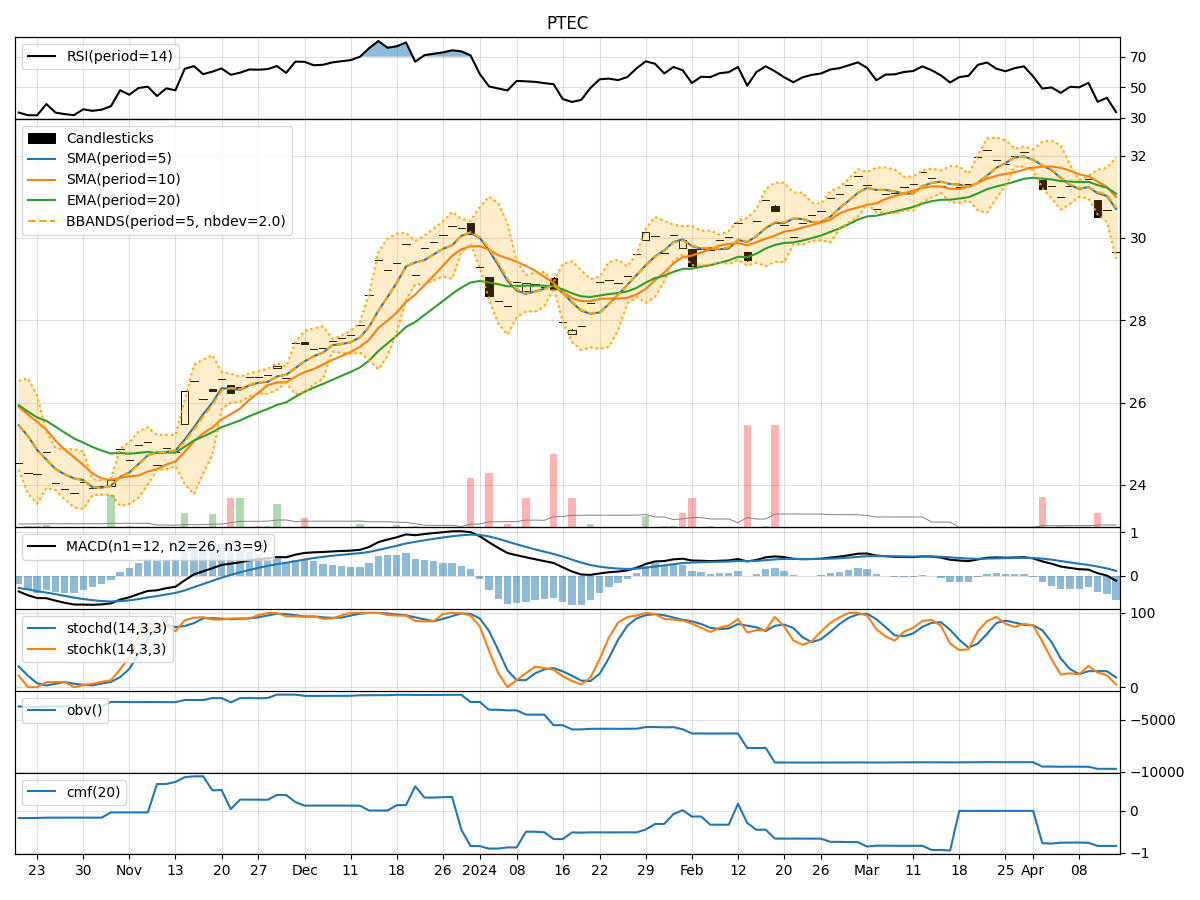
- Moving Averages (MA): The 5-day MA has been consistently above the 10-day SMA, indicating a short-term bullish trend.
- MACD: The MACD line has been above the signal line, with both showing an upward trend, suggesting bullish momentum.
Momentum Analysis:
- RSI: The RSI has been fluctuating around the 60-65 range, indicating a neutral momentum.
- Stochastic Oscillator: The Stochastic indicators have been gradually decreasing, signaling a potential shift towards oversold conditions.
Volatility Analysis:
- Bollinger Bands (BB): The stock price has been trading within the Bollinger Bands, with the bands narrowing, suggesting a decrease in volatility.
Volume Analysis:
- On-Balance Volume (OBV): The OBV has been relatively stable, indicating a balance between buying and selling pressure.
Key Observations:
- The trend indicators suggest a bullish sentiment in the short term.
- Momentum indicators show a neutral stance with a slight inclination towards oversold conditions.
- Volatility has been decreasing, indicating a potential period of consolidation.
- Volume indicators reflect a balanced market sentiment with no significant divergence.
Conclusion:
Based on the analysis of the technical indicators, the stock price of PTEC is likely to experience sideways movement in the coming days. The bullish trend indicated by moving averages and MACD may be offset by the neutral momentum and decreasing stochastic indicators. The decreasing volatility and balanced volume further support the view of a consolidation phase. Therefore, investors should expect the stock price to consolidate in the near term without a clear directional bias. It is advisable to closely monitor key support and resistance levels for potential breakout opportunities.