Technical Analysis of PTEU 2024-05-10
Overview:
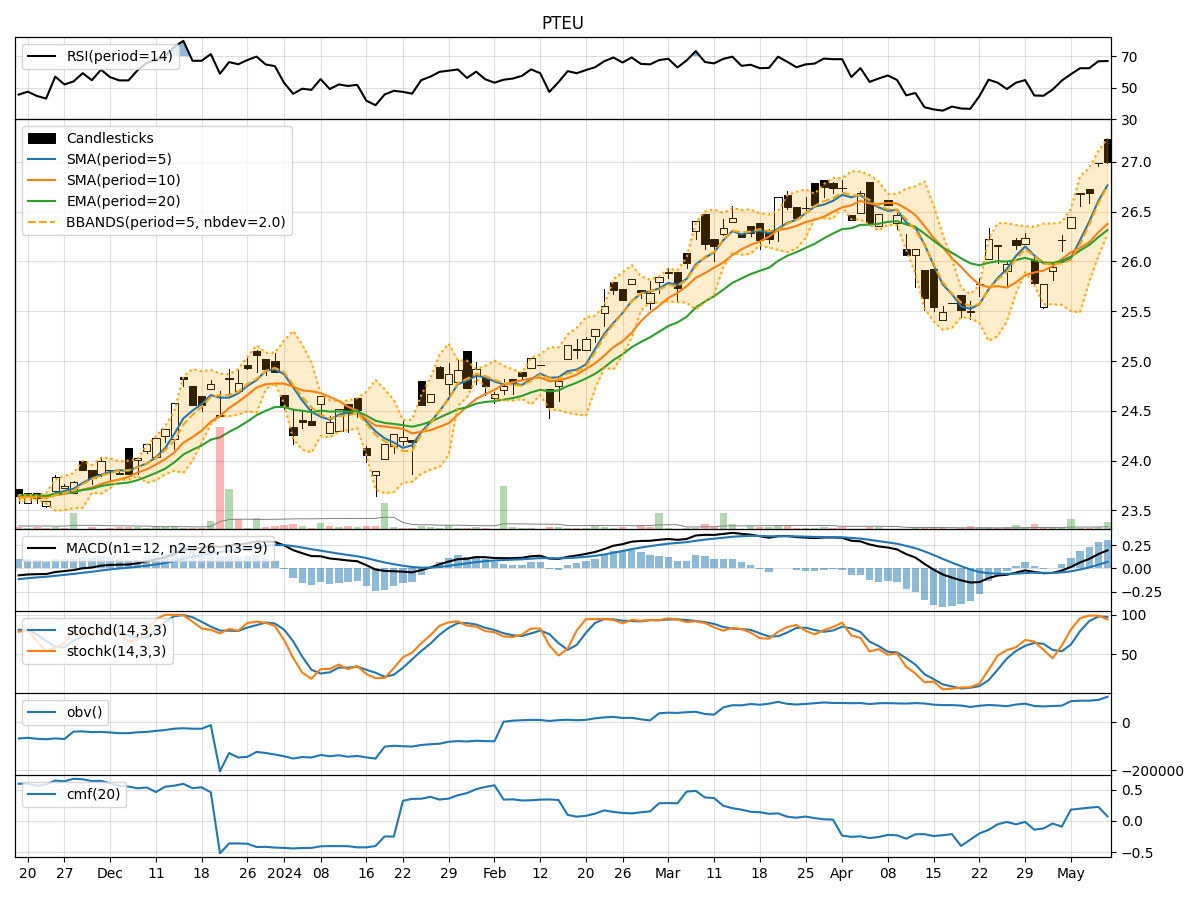
In analyzing the technical indicators for PTEU over the last 5 days, we will delve into the trend, momentum, volatility, and volume indicators to provide a comprehensive outlook on the possible stock price movement in the coming days. By examining these key aspects, we aim to offer valuable insights and recommendations for potential investors.
Trend Indicators:
- Moving Averages (MA): The 5-day Moving Average has been consistently above the Simple Moving Average (SMA) and Exponential Moving Average (EMA), indicating a bullish trend.
- MACD: The MACD line has been consistently above the signal line, with both lines showing an upward trend, suggesting bullish momentum.
- MACD Histogram: The MACD Histogram has been increasing over the past 5 days, indicating strengthening bullish momentum.
Momentum Indicators:
- RSI: The Relative Strength Index (RSI) has been in the overbought territory, indicating a strong bullish momentum.
- Stochastic Oscillator: Both %K and %D lines of the Stochastic Oscillator have been in the overbought zone, suggesting a potential reversal or consolidation.
- Williams %R: The Williams %R has been in the oversold territory, indicating a potential buying opportunity.
Volatility Indicators:
- Bollinger Bands: The stock price has been trading within the Bollinger Bands, with the bands widening slightly, indicating increased volatility.
- Bollinger %B: The %B indicator has been fluctuating around the midline, suggesting a balanced market sentiment.
Volume Indicators:
- On-Balance Volume (OBV): The OBV has been steadily increasing over the last 5 days, indicating strong buying pressure.
- Chaikin Money Flow (CMF): The CMF has been positive, indicating that money is flowing into the stock.
Key Observations and Opinions:
- Trend: The trend indicators suggest a strong bullish sentiment in the stock.
- Momentum: While the RSI and Stochastic Oscillator indicate overbought conditions, the Williams %R shows potential for a reversal.
- Volatility: The widening Bollinger Bands suggest increased volatility in the stock.
- Volume: The rising OBV and positive CMF indicate strong buying interest in the stock.
Conclusion:
Based on the analysis of the technical indicators, the stock of PTEU is currently exhibiting strong bullish momentum, supported by positive trend and volume indicators. However, the overbought conditions in the RSI and Stochastic Oscillator signal a potential reversal or consolidation in the near term. Considering the overall picture, the stock is likely to experience a short-term consolidation or pullback before potentially resuming its upward trajectory. Investors should closely monitor key support and resistance levels for potential entry or exit points.
Recommendation:
Given the current technical outlook, it is advisable for investors to exercise caution and wait for a clearer signal before initiating new positions. Traders may consider implementing risk management strategies to protect gains in case of a sudden reversal. Long-term investors can use any pullback as an opportunity to accumulate the stock at more favorable prices. As always, it is essential to monitor the market closely and adapt to changing conditions to make informed investment decisions.