Technical Analysis of PTF 2024-05-10
Overview:
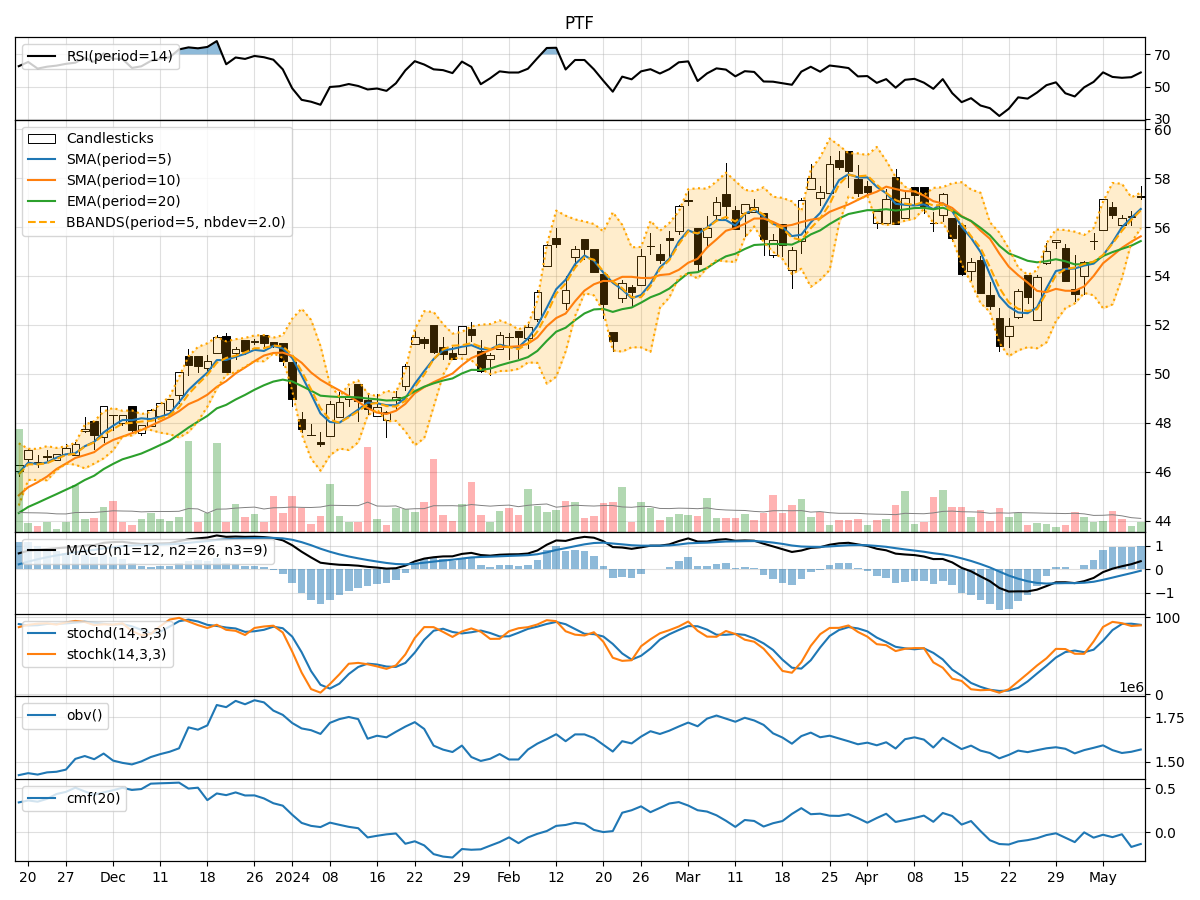
In the last 5 trading days, the stock has shown a consistent uptrend in terms of moving averages, with the MACD indicating a positive momentum. The RSI has been fluctuating but generally staying in the overbought territory, indicating strong buying pressure. Volatility has been decreasing, and the OBV has shown mixed signals. Let's delve deeper into each category of technical indicators to provide a comprehensive analysis.
Trend Indicators:
- Moving Averages (MA): The stock price has been consistently above the 5-day moving average, indicating a short-term uptrend.
- MACD: The MACD line has been above the signal line, suggesting a bullish momentum.
- MACD Histogram: The histogram has been increasing, indicating strengthening bullish momentum.
Momentum Indicators:
- RSI: The RSI has been fluctuating but generally staying in the overbought territory, suggesting a strong buying pressure.
- Stochastic Oscillator: Both %K and %D have been in the overbought zone, indicating a potential reversal.
Volatility Indicators:
- Bollinger Bands (BB): The bands have been narrowing, indicating decreasing volatility.
- Bollinger %B: The %B has been increasing, suggesting a potential breakout.
Volume Indicators:
- On-Balance Volume (OBV): The OBV has shown mixed signals, indicating some divergence between price and volume movements.
- Chaikin Money Flow (CMF): The CMF has been negative, indicating a lack of buying pressure.
Key Observations:
- The stock is in an uptrend based on moving averages and MACD.
- Momentum indicators like RSI and Stochastic Oscillator suggest overbought conditions and a potential reversal.
- Volatility has been decreasing, indicating a possible period of consolidation.
- Volume indicators show mixed signals, with OBV diverging from price movements.
Conclusion:
Based on the analysis of technical indicators, the next few days' possible stock price movement could see a short-term correction or consolidation. The stock is currently in overbought territory, and the narrowing Bollinger Bands suggest a potential breakout or reversal. Traders should be cautious and consider taking profits or implementing risk management strategies. Expect a short-term downward correction or sideways movement before a potential continuation of the uptrend.