Technical Analysis of PTLC 2024-05-10
Overview:
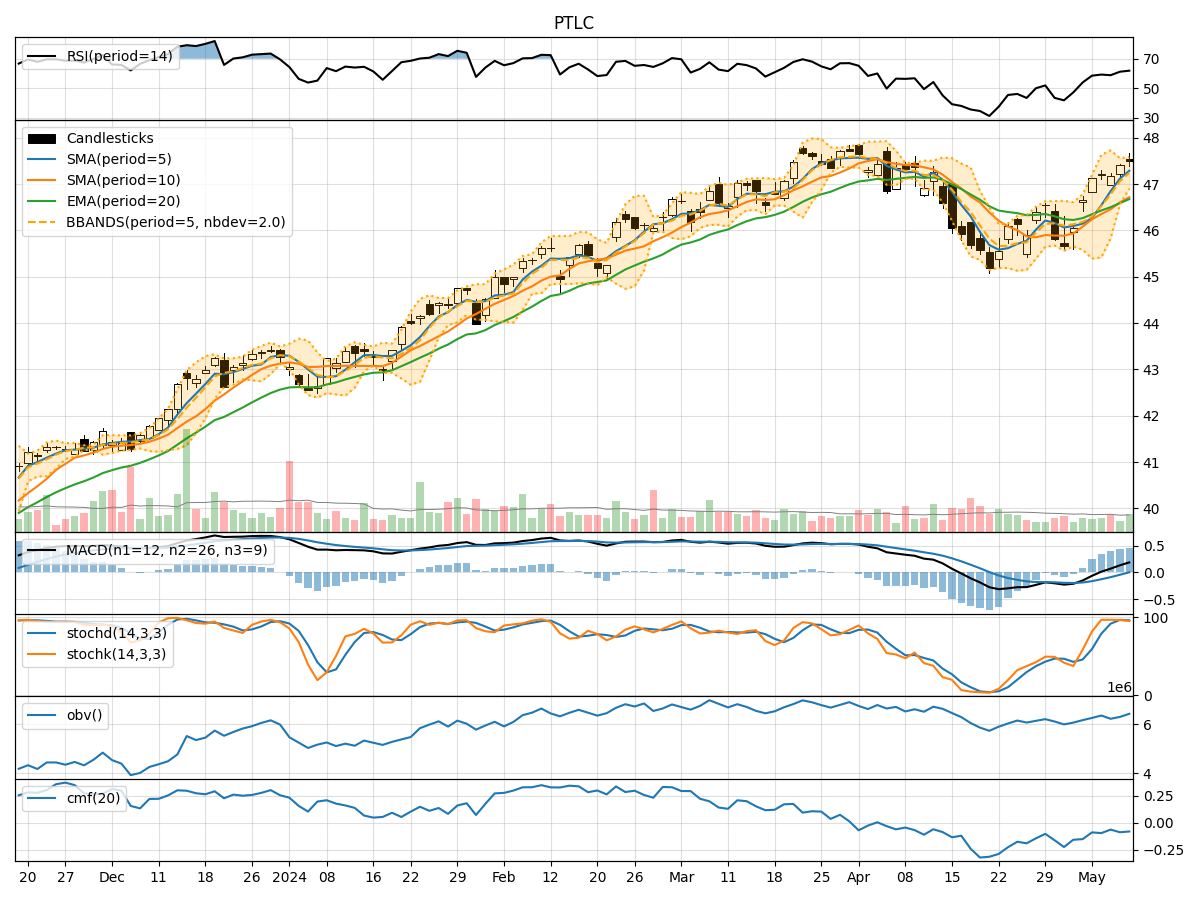
In analyzing the technical indicators for PTLC over the last 5 days, we will delve into the trend, momentum, volatility, and volume indicators to provide a comprehensive outlook on the possible stock price movement in the coming days. By examining these key indicators, we aim to offer valuable insights and predictions for potential investors.
Trend Analysis:
- Moving Averages (MA): The 5-day MA has been consistently above the closing prices, indicating a bullish trend.
- MACD: The MACD line has been trending upwards, crossing above the signal line, suggesting a bullish momentum.
- RSI: The RSI values have been in the range of 50-70, indicating a moderate bullish sentiment.
Momentum Analysis:
- Stochastic Oscillator: Both %K and %D values have been consistently high, signaling strong bullish momentum.
- Williams %R: The values have been fluctuating around oversold levels, indicating potential buying opportunities.
Volatility Analysis:
- Bollinger Bands (BB): The stock price has been trading within the bands, with the %B indicator showing a slight uptrend.
- Average True Range (ATR): The ATR values have been relatively stable, suggesting consistent price movements.
Volume Analysis:
- On-Balance Volume (OBV): The OBV values have been mixed, indicating some distribution of shares.
- Chaikin Money Flow (CMF): The CMF values have been negative, suggesting outflow of money from the stock.
Key Observations:
- The trend indicators suggest a bullish sentiment with moving averages and MACD showing positive signals.
- Momentum indicators indicate strong bullish momentum, especially with high Stochastic values.
- Volatility remains relatively stable, with the stock price trading within the Bollinger Bands.
- Volume indicators show mixed signals, with OBV indicating some selling pressure.
Conclusion:
Based on the analysis of the technical indicators, the overall outlook for PTLC in the next few days is bullish. The stock is likely to experience upward price movement driven by the positive trend and momentum signals. Traders may consider buying opportunities based on the strong bullish momentum indicated by the Stochastic oscillator. However, it is essential to monitor the volume indicators closely for any signs of reversal or increased selling pressure. Investors should consider a bullish stance on PTLC for the upcoming trading sessions.