Technical Analysis of PUTD 2024-05-10
Overview:
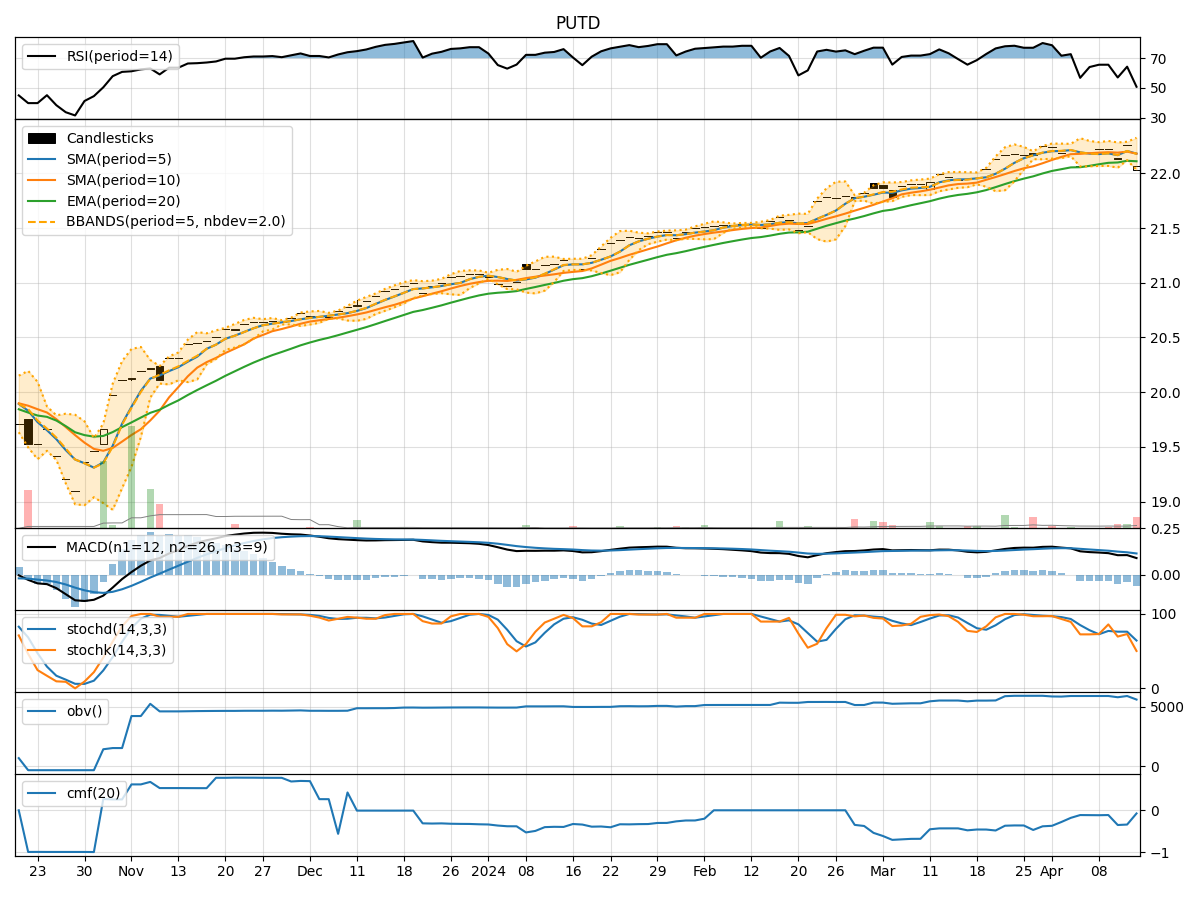
In the last 5 trading days, the stock has shown a consistent uptrend based on the trend indicators, with the moving averages (MA) and Exponential Moving Average (EMA) all trending upwards. Momentum indicators like Relative Strength Index (RSI) and Stochastic Oscillator suggest the stock is in overbought territory. Volatility indicators like Bollinger Bands (BB) show narrowing bands, indicating decreasing volatility. Volume indicators like On-Balance Volume (OBV) and Chaikin Money Flow (CMF) are negative, suggesting selling pressure.
Trend Indicators:
- Moving Averages (MA): The 5-day MA is consistently above the closing price, indicating a bullish trend.
- MACD: The MACD line is above the signal line, indicating a bullish trend.
- EMA: The EMA is trending upwards, supporting the bullish sentiment.
- Conclusion: The trend indicators suggest a strong bullish trend in the stock price.
Momentum Indicators:
- RSI: RSI is in the overbought zone, indicating a potential reversal or consolidation.
- Stochastic Oscillator: Both %K and %D are at 100, signaling overbought conditions.
- Conclusion: Momentum indicators suggest a potential reversal or consolidation in the stock price.
Volatility Indicators:
- Bollinger Bands: The bands are narrowing, indicating decreasing volatility and a potential price breakout.
- Conclusion: Volatility indicators suggest a potential price breakout due to the narrowing bands.
Volume Indicators:
- OBV: On-Balance Volume is negative, indicating more selling volume than buying volume.
- CMF: Chaikin Money Flow is negative, suggesting a lack of buying pressure.
- Conclusion: Volume indicators point towards selling pressure in the stock.
Overall Conclusion:
Based on the analysis of the technical indicators: - The trend indicators suggest a strong bullish trend. - Momentum indicators indicate a potential reversal or consolidation due to overbought conditions. - Volatility indicators hint at a potential price breakout with decreasing volatility. - Volume indicators show selling pressure with negative OBV and CMF.
Forecast:
Considering the overall analysis, the stock is likely to experience a short-term consolidation or pullback in the next few days due to overbought momentum and selling pressure indicated by volume indicators. However, the strong bullish trend indicated by trend indicators may lead to a resumption of the uptrend after the consolidation phase. Traders should watch for signs of reversal or consolidation before considering entry or exit points.
Key Recommendations:
- Monitor Price Action: Watch for signs of consolidation or reversal in price movement.
- Confirm Breakout: Wait for confirmation of a breakout from the narrowing Bollinger Bands.
- Consider Risk Management: Implement proper risk management strategies to protect against potential downside risks during the consolidation phase.
Disclaimer:
This analysis is based solely on technical indicators and historical data. Market conditions can change rapidly, and it is essential to consider other factors such as fundamental analysis and external market influences before making any trading decisions. Always conduct thorough research and consult with a financial advisor before making investment decisions.