Technical Analysis of PUTW 2024-05-10
Overview:
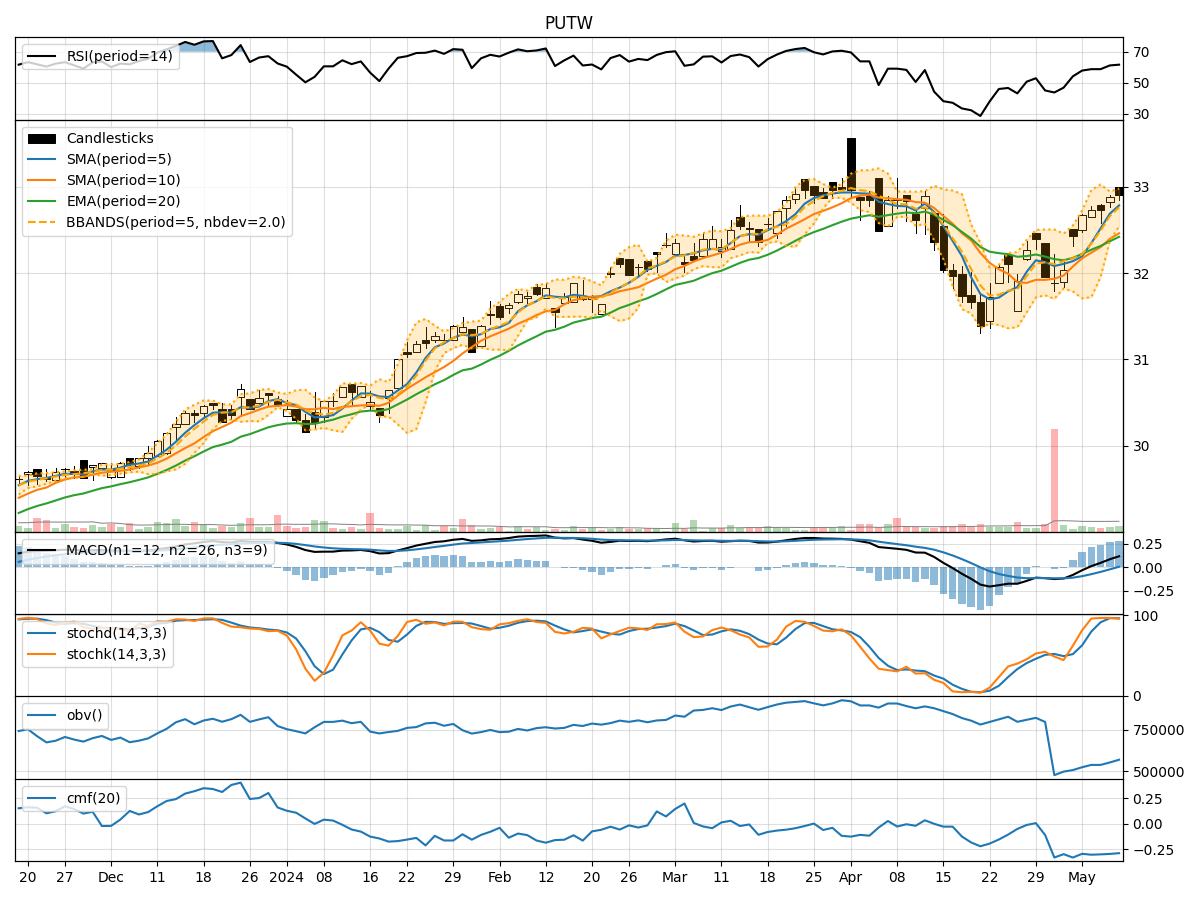
In analyzing the technical indicators for PUTW over the last 5 days, we will delve into the trend, momentum, volatility, and volume indicators to provide a comprehensive outlook on the possible stock price movement in the coming days.
Trend Analysis:
- Moving Averages (MA): The 5-day Moving Average has been consistently above the closing prices, indicating a short-term uptrend.
- MACD: The MACD line has been above the signal line for the past few days, suggesting bullish momentum.
- RSI: The Relative Strength Index has been in the neutral to slightly overbought territory, indicating potential strength in the current trend.
Momentum Analysis:
- Stochastic Oscillator: Both %K and %D have been in the overbought zone, signaling a strong bullish momentum.
- Williams %R: The Williams %R is in the oversold region, suggesting a potential reversal or consolidation.
Volatility Analysis:
- Bollinger Bands: The stock price has been trading within the upper Bollinger Band, indicating increased volatility and a potential continuation of the uptrend.
- Average True Range (ATR): ATR has shown a slight increase, suggesting a rise in volatility.
Volume Analysis:
- On-Balance Volume (OBV): The OBV has been declining, indicating a potential distribution phase.
- Chaikin Money Flow (CMF): The CMF has been negative, suggesting selling pressure in the stock.
Key Observations:
- The trend indicators suggest a bullish bias in the short term.
- Momentum indicators point towards a strong bullish momentum.
- Volatility indicators indicate an increase in price fluctuations.
- Volume indicators show a divergence between OBV and CMF, signaling a potential conflict in market sentiment.
Conclusion:
Based on the analysis of the technical indicators, the next few days' possible stock price movement for PUTW is likely to continue in an upward direction with increased volatility. The bullish trend supported by momentum indicators may lead to further price appreciation, but caution is advised due to the conflicting signals from volume indicators. Traders should closely monitor price action and key support/resistance levels for potential entry or exit points.
Recommendation:
- Short-term Traders: Consider taking long positions with tight stop-loss levels to capitalize on the bullish momentum.
- Long-term Investors: Monitor the price action closely and consider booking profits if the stock reaches overbought levels.
- Risk Management: Implement proper risk management strategies to protect capital in case of unexpected market movements.
By integrating these insights and recommendations, investors can make informed decisions aligned with the current market dynamics and technical indicators for PUTW.