Technical Analysis of PWER 2024-05-10
Overview:
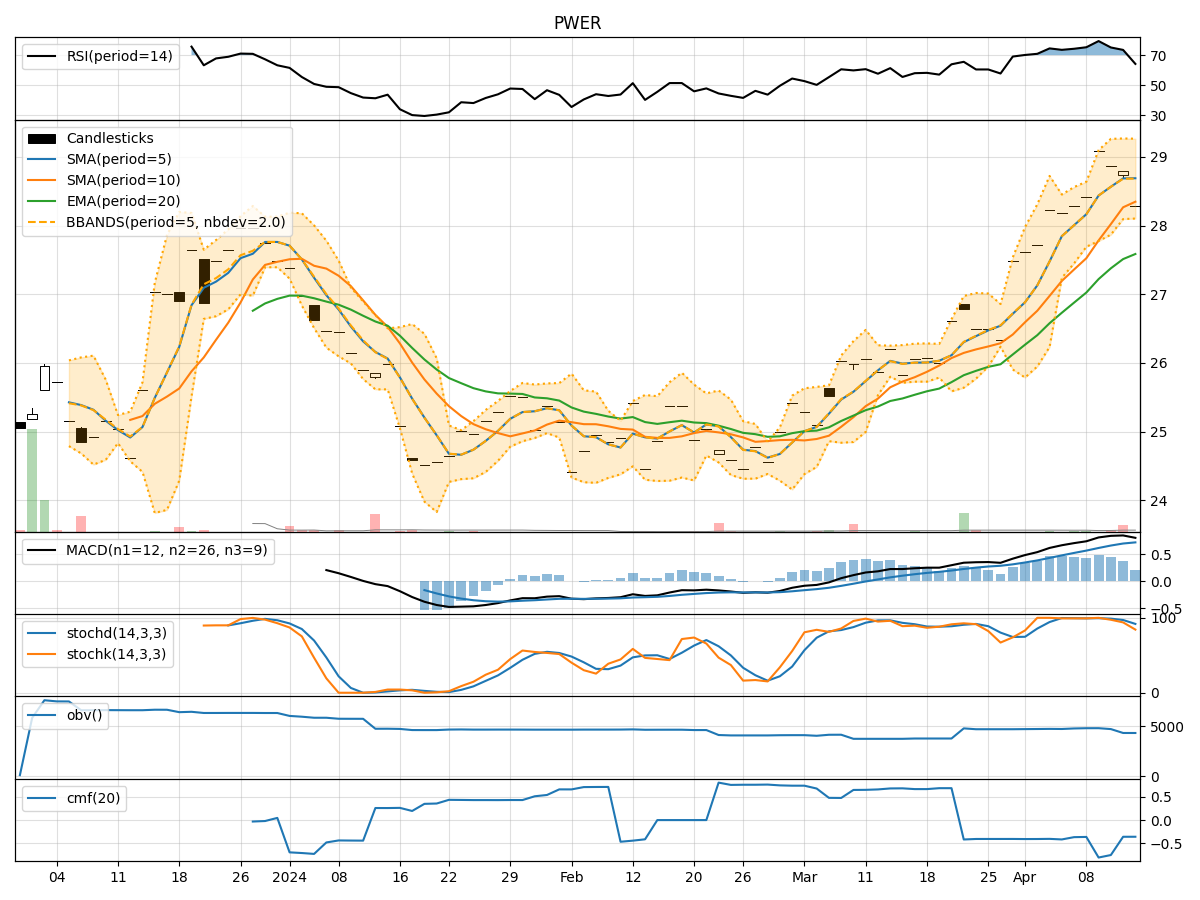
In analyzing the technical indicators for PWER over the last 5 days, we will delve into the trend, momentum, volatility, and volume indicators to provide a comprehensive outlook on the possible stock price movement in the coming days.
Trend Indicators:
- Moving Averages (MA): The 5-day MA has been consistently above the closing prices, indicating a short-term uptrend.
- MACD: The MACD line has been positive, suggesting bullish momentum.
- RSI: The RSI values have been fluctuating around the 60-70 range, indicating a neutral to slightly bullish sentiment.
Momentum Indicators:
- Stochastic Oscillator: The Stochastic Oscillator has been in the overbought zone, suggesting a potential reversal or consolidation.
- Williams %R: The Williams %R has been hovering in the oversold territory, indicating a possible buying opportunity.
Volatility Indicators:
- Bollinger Bands (BB): The stock price has been trading within the Bollinger Bands, indicating normal volatility.
- BB% (Bollinger Band %B): The BB% has been relatively stable, suggesting a lack of extreme price movements.
Volume Indicators:
- On-Balance Volume (OBV): The OBV has been slightly negative, indicating some distribution.
- Chaikin Money Flow (CMF): The CMF has been positive, reflecting buying pressure.
Key Observations and Opinions:
- Trend: The trend indicators suggest a bullish bias in the short term.
- Momentum: Mixed signals from the momentum indicators indicate a potential reversal or consolidation.
- Volatility: Volatility indicators point towards a stable price movement.
- Volume: The volume indicators show a slight distribution but with positive buying pressure.
Conclusion:
Based on the analysis of the technical indicators, the next few days' possible stock price movement for PWER could be sideways with a slight bullish bias. Traders should watch for potential reversals indicated by the Stochastic Oscillator and Williams %R, while also considering the positive trend signals from moving averages and MACD. It is essential to monitor volume and volatility for any shifts in market sentiment. Overall, a cautious approach with a focus on key support and resistance levels is recommended.