Technical Analysis of PXE 2024-05-10
Overview:
In analyzing the technical indicators for PXE stock over the last 5 days, we will delve into the trend, momentum, volatility, and volume indicators to provide a comprehensive outlook on the possible stock price movement in the coming days. By examining these key indicators, we aim to offer valuable insights and recommendations for potential investors.
Trend Analysis:
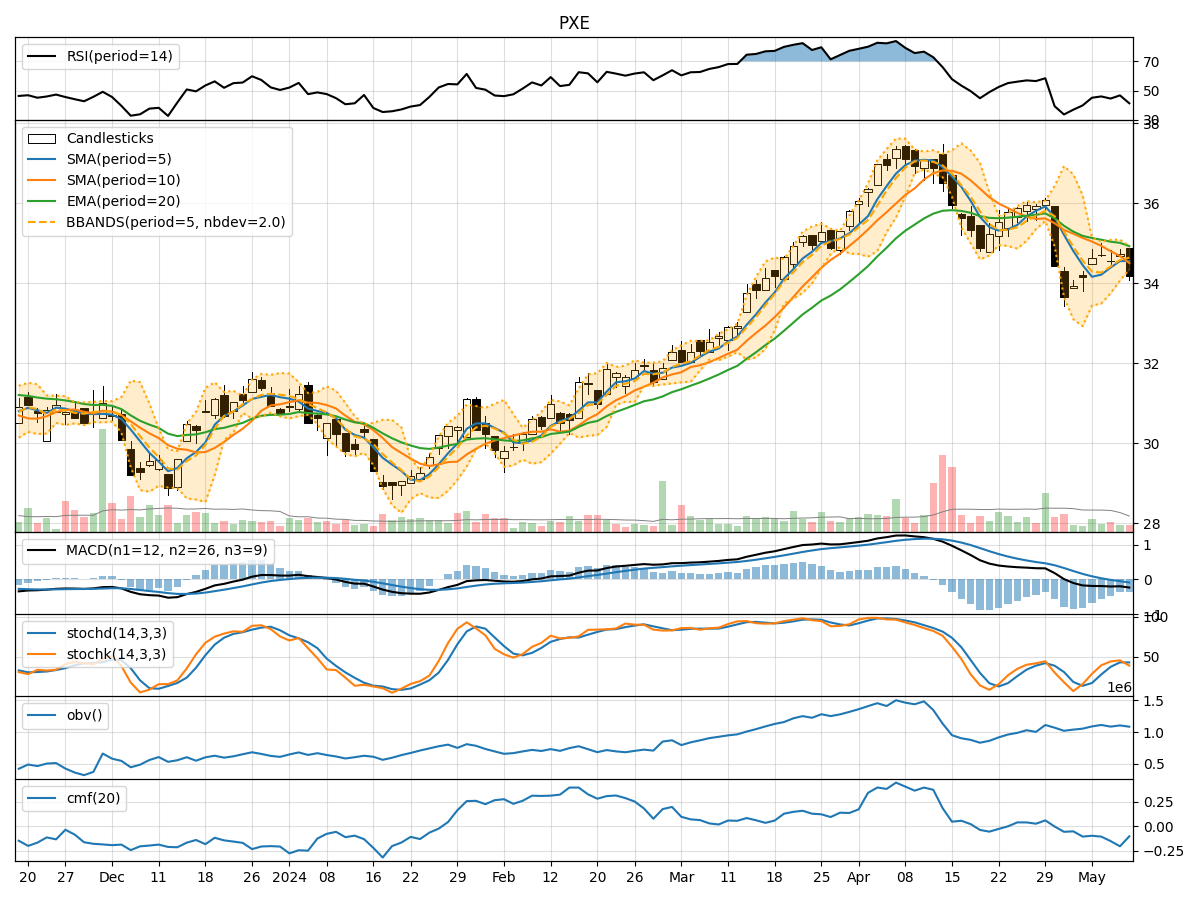
- Moving Averages (MA): The 5-day Moving Average (MA) has been fluctuating around the closing prices, indicating a lack of clear trend direction.
- MACD: The Moving Average Convergence Divergence (MACD) has been consistently negative, suggesting a bearish momentum in the short term.
- EMA: The Exponential Moving Average (EMA) has been declining, further supporting the bearish sentiment in the stock.
Momentum Analysis:
- RSI: The Relative Strength Index (RSI) has been hovering around the mid-range, indicating a neutral momentum with no clear overbought or oversold conditions.
- Stochastic Oscillator: Both %K and %D lines of the Stochastic Oscillator have been fluctuating, reflecting indecision in the momentum.
- Williams %R: The Williams %R is in oversold territory, suggesting a potential reversal or consolidation phase.
Volatility Analysis:
- Bollinger Bands: The Bollinger Bands have been narrowing, indicating decreasing volatility in the stock price.
- Bollinger %B: The %B indicator is close to 0, suggesting the stock is trading near the lower band, potentially indicating an oversold condition.
Volume Analysis:
- On-Balance Volume (OBV): The OBV has been fluctuating, indicating mixed buying and selling pressure in the stock.
- Chaikin Money Flow (CMF): The CMF has been negative, indicating a bearish money flow in the stock.
Key Observations:
- The trend indicators suggest a bearish sentiment with declining moving averages and negative MACD.
- Momentum indicators show a lack of clear direction, with RSI in neutral territory and stochastic oscillators fluctuating.
- Volatility is decreasing, as indicated by the narrowing Bollinger Bands.
- Volume indicators reflect mixed buying and selling pressure, with a bearish money flow according to the CMF.
Conclusion:
Based on the analysis of the technical indicators, the stock is likely to experience further downward movement in the coming days. The bearish trend, coupled with neutral momentum and decreasing volatility, indicates a potential continuation of the current downtrend. Investors should exercise caution and consider waiting for more definitive signals before making any trading decisions.