Technical Analysis of PXF 2024-05-10
Overview:
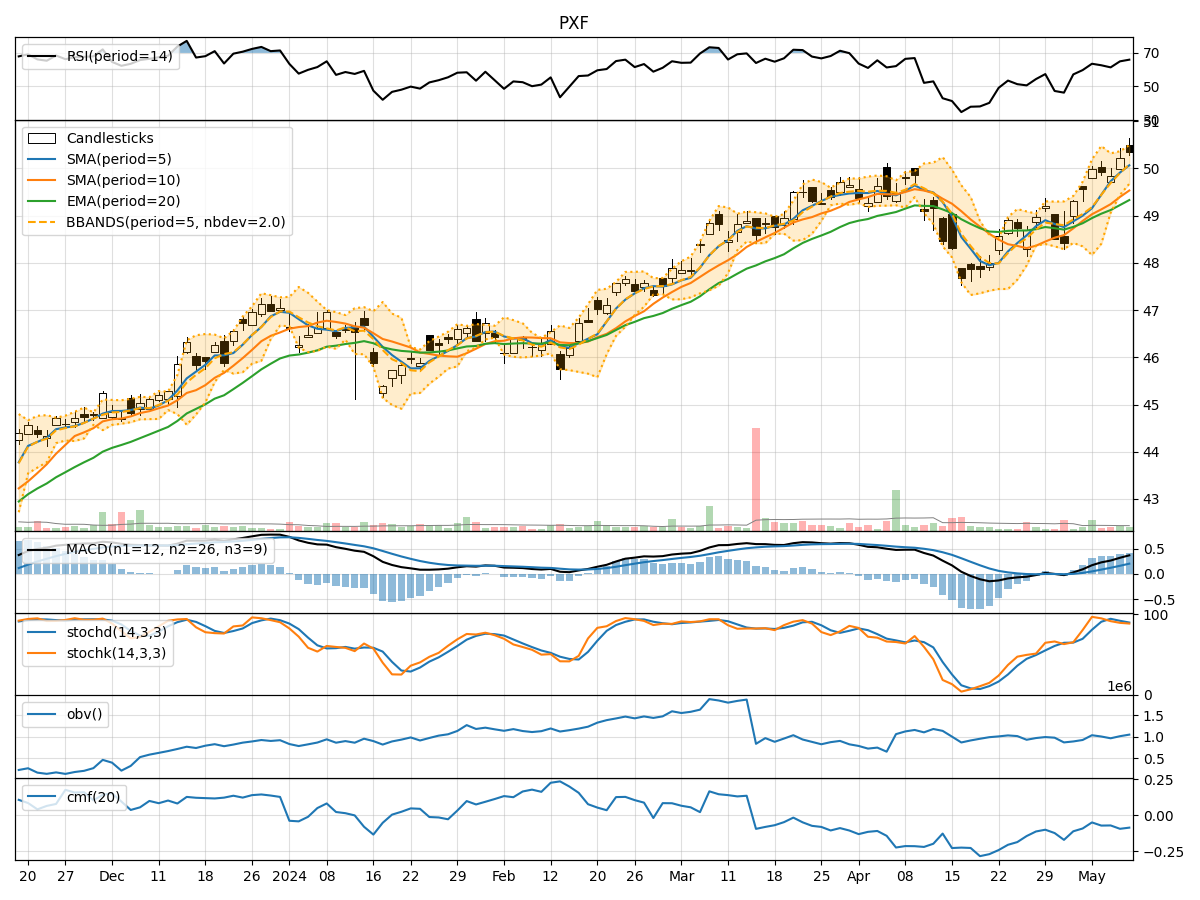
In analyzing the technical indicators for PXF over the last 5 days, we will delve into the trend, momentum, volatility, and volume indicators to provide a comprehensive outlook on the possible stock price movement in the coming days. By examining these key aspects, we aim to offer valuable insights and recommendations for potential investors.
Trend Analysis:
- Moving Averages (MA): The 5-day Moving Average (MA) has been consistently above the Simple Moving Average (SMA) and Exponential Moving Average (EMA), indicating a bullish trend.
- MACD: The MACD line has been above the signal line, with both lines showing an upward trend, suggesting bullish momentum.
Key Observation: The trend indicators point towards an upward movement in the stock price.
Momentum Analysis:
- RSI: The Relative Strength Index (RSI) has been fluctuating around the overbought territory, indicating strong buying momentum.
- Stochastic Oscillator: Both %K and %D have been in the overbought zone, suggesting a strong bullish momentum.
Key Observation: The momentum indicators signal a bullish sentiment in the market.
Volatility Analysis:
- Bollinger Bands (BB): The stock price has been trading within the upper Bollinger Band (BBU), indicating high volatility.
Key Observation: Volatility is currently high, which may lead to significant price swings in the near term.
Volume Analysis:
- On-Balance Volume (OBV): The OBV has been fluctuating, indicating indecision among investors.
- Chaikin Money Flow (CMF): The CMF has been negative, suggesting a lack of buying pressure.
Key Observation: Volume indicators reflect mixed signals with no clear direction.
Conclusion:
Based on the analysis of the technical indicators, the overall outlook for PXF suggests a bullish trend with strong momentum. However, the high volatility and mixed volume signals indicate a degree of uncertainty in the market. Investors should consider the bullish trend and momentum but remain cautious of potential price swings due to high volatility. It is advisable to monitor the price action closely and consider risk management strategies to navigate the market effectively.
In conclusion, the next few days may see an upward movement in the stock price, driven by the bullish trend and momentum, but investors should be prepared for potential volatility and exercise caution in their trading decisions.