Technical Analysis of PY 2024-05-10
Overview:
In analyzing the technical indicators for the stock PY over the last 5 days, we will delve into the trends, momentum, volatility, and volume indicators to provide a comprehensive outlook on the possible stock price movement in the coming days. By examining these key indicators, we aim to offer valuable insights and predictions for potential investors.
Trend Indicators:
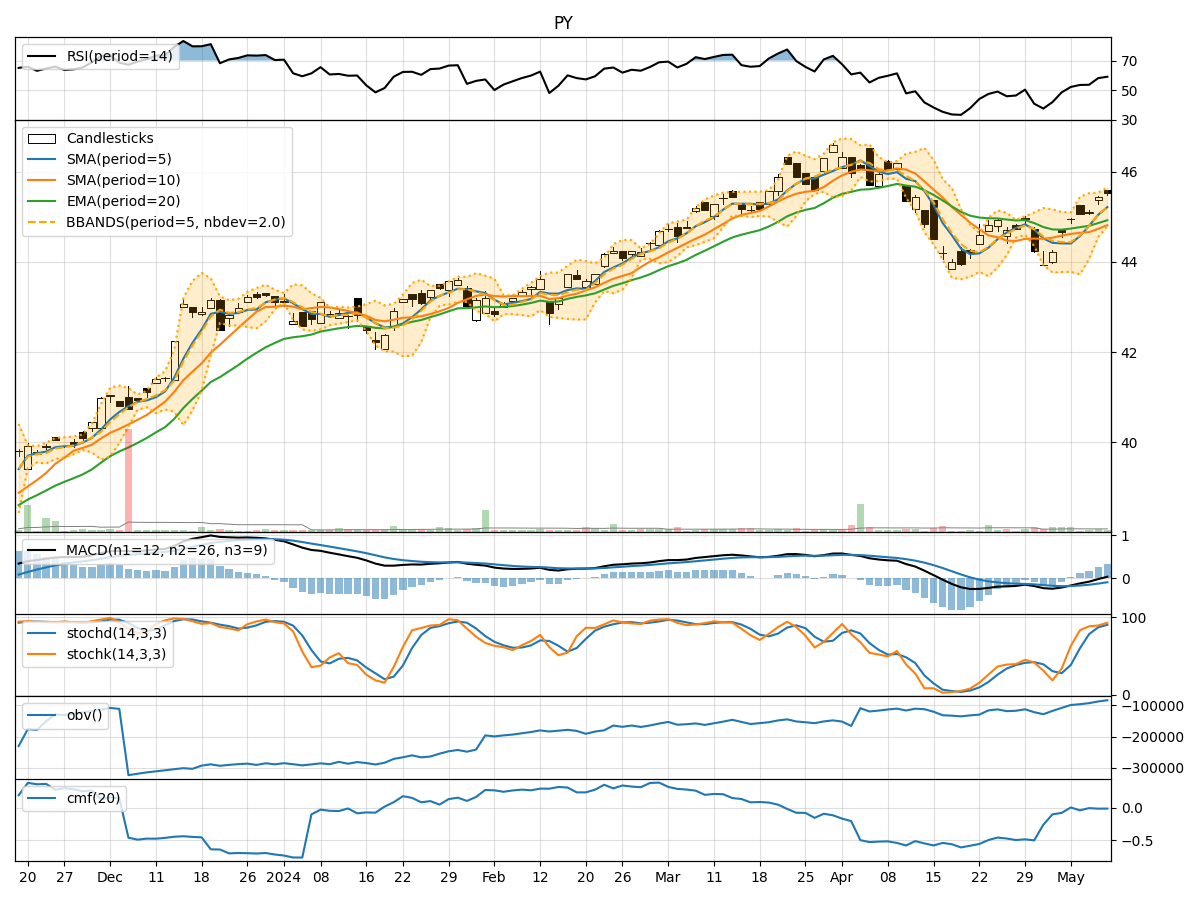
- Moving Averages (MA): The 5-day MA has been consistently above the closing prices, indicating a short-term uptrend.
- MACD: The MACD line has been positive and increasing, suggesting bullish momentum.
- RSI: The RSI has been trending upwards, indicating strengthening buying pressure.
Momentum Indicators:
- Stochastic Oscillator: Both %K and %D have been in overbought territory, signaling a potential reversal or consolidation.
- Williams %R: The indicator has been in oversold territory, suggesting a possible buying opportunity.
Volatility Indicators:
- Bollinger Bands (BB): The stock price has been trading within the bands, indicating normal volatility.
- BB Percentage (BBP): The BBP has been fluctuating around 0.8, suggesting moderate volatility.
Volume Indicators:
- On-Balance Volume (OBV): The OBV has been increasing, indicating accumulation by investors.
- Chaikin Money Flow (CMF): The CMF has been negative, suggesting some selling pressure.
Key Observations:
- The stock has shown a bullish trend based on moving averages and MACD.
- Momentum indicators suggest a potential reversal or consolidation due to overbought conditions.
- Volatility has been moderate, with the stock price trading within the Bollinger Bands.
- Volume indicators show accumulation but with some selling pressure based on CMF.
Conclusion:
Based on the analysis of the technical indicators, the stock PY is likely to experience a short-term consolidation or pullback in the coming days. The overbought conditions in momentum indicators and negative CMF signal a potential pause in the bullish trend. Investors should exercise caution and consider waiting for a better entry point before initiating new positions.