Technical Analysis of PYZ 2024-05-10
Overview:
In analyzing the technical indicators for PYZ stock over the last 5 days, we will delve into the trend, momentum, volatility, and volume indicators to provide a comprehensive outlook on the possible future stock price movement. By examining these key indicators, we aim to offer valuable insights and predictions for the upcoming trading days.
Trend Analysis:
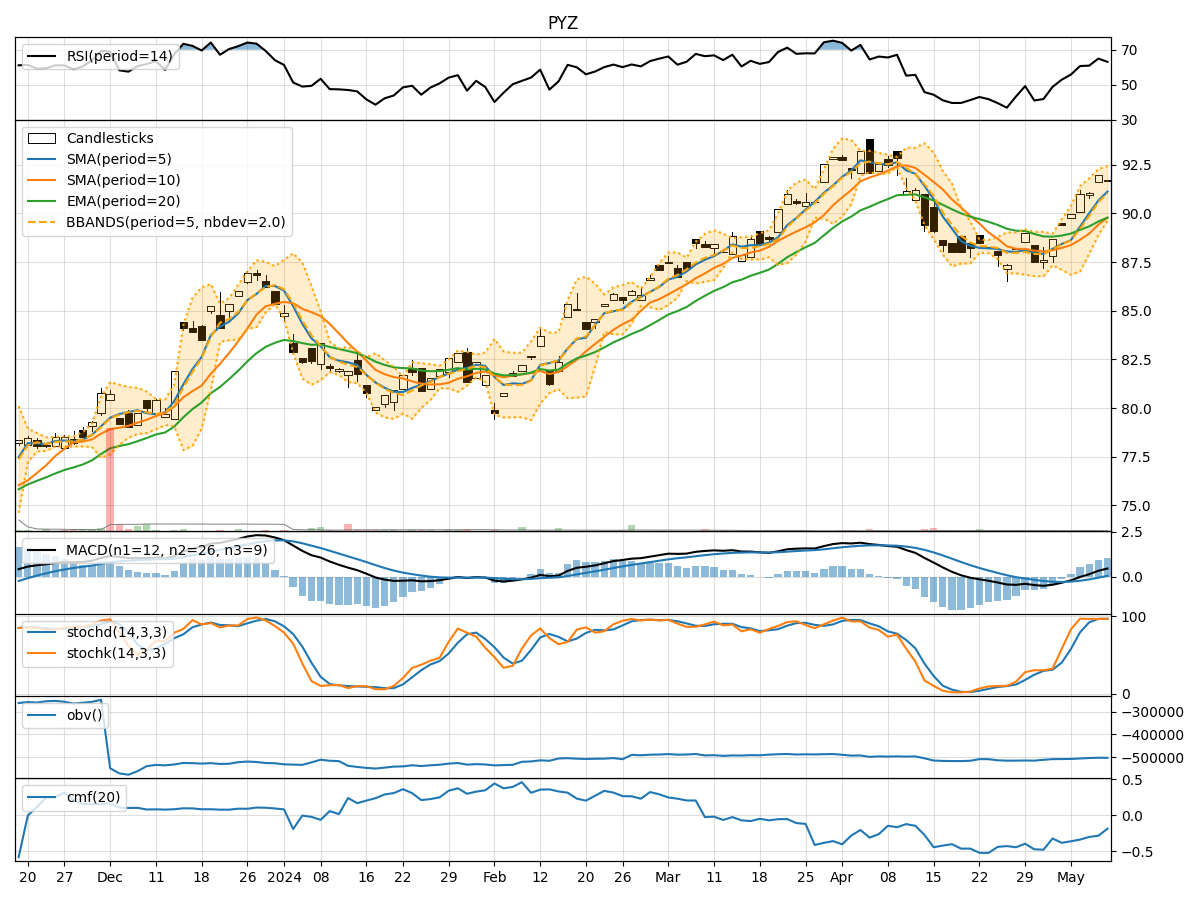
- Moving Averages (MA): The 5-day Moving Average (MA) has been consistently trending upwards, indicating a bullish momentum in the short term.
- MACD: The MACD line has been above the signal line for the past few days, suggesting a positive trend in momentum.
- EMA: The Exponential Moving Average (EMA) has also been on an upward trajectory, supporting the bullish sentiment in the market.
Momentum Analysis:
- RSI: The Relative Strength Index (RSI) has been increasing, reaching above 50, which indicates growing buying pressure and potential upward movement.
- Stochastic Oscillator: Both %K and %D lines of the Stochastic Oscillator are in the overbought zone, signaling a strong bullish momentum.
- Williams %R: The Williams %R indicator is also in the oversold region, suggesting a potential reversal to the upside.
Volatility Analysis:
- Bollinger Bands (BB): The Bollinger Bands have been widening, indicating increased volatility in the stock price.
- BB% (Bollinger Bands %B): The %B value has been fluctuating within a range, suggesting potential price swings in the near future.
Volume Analysis:
- On-Balance Volume (OBV): The OBV indicator has been relatively stable, showing a consistent accumulation of volume despite minor fluctuations.
- Chaikin Money Flow (CMF): The CMF has been negative, indicating some selling pressure in the market.
Key Observations:
- The trend indicators suggest a bullish sentiment with moving averages and MACD supporting an upward trend.
- Momentum indicators like RSI and Stochastic Oscillator point towards a strong buying momentum.
- Volatility indicators show an increase in price fluctuations, which could lead to potential trading opportunities.
- Volume indicators reflect a stable accumulation of volume despite some selling pressure indicated by CMF.
Conclusion:
Based on the analysis of the technical indicators, the overall outlook for PYZ stock in the next few days is bullish. The trend is positive, momentum is strong, and volatility could present trading opportunities. However, it is essential to monitor the indicators closely for any signs of reversal or consolidation. Traders and investors may consider taking long positions or capitalizing on short-term price movements based on the current technical outlook.