Technical Analysis of QABA 2024-05-10
Overview:
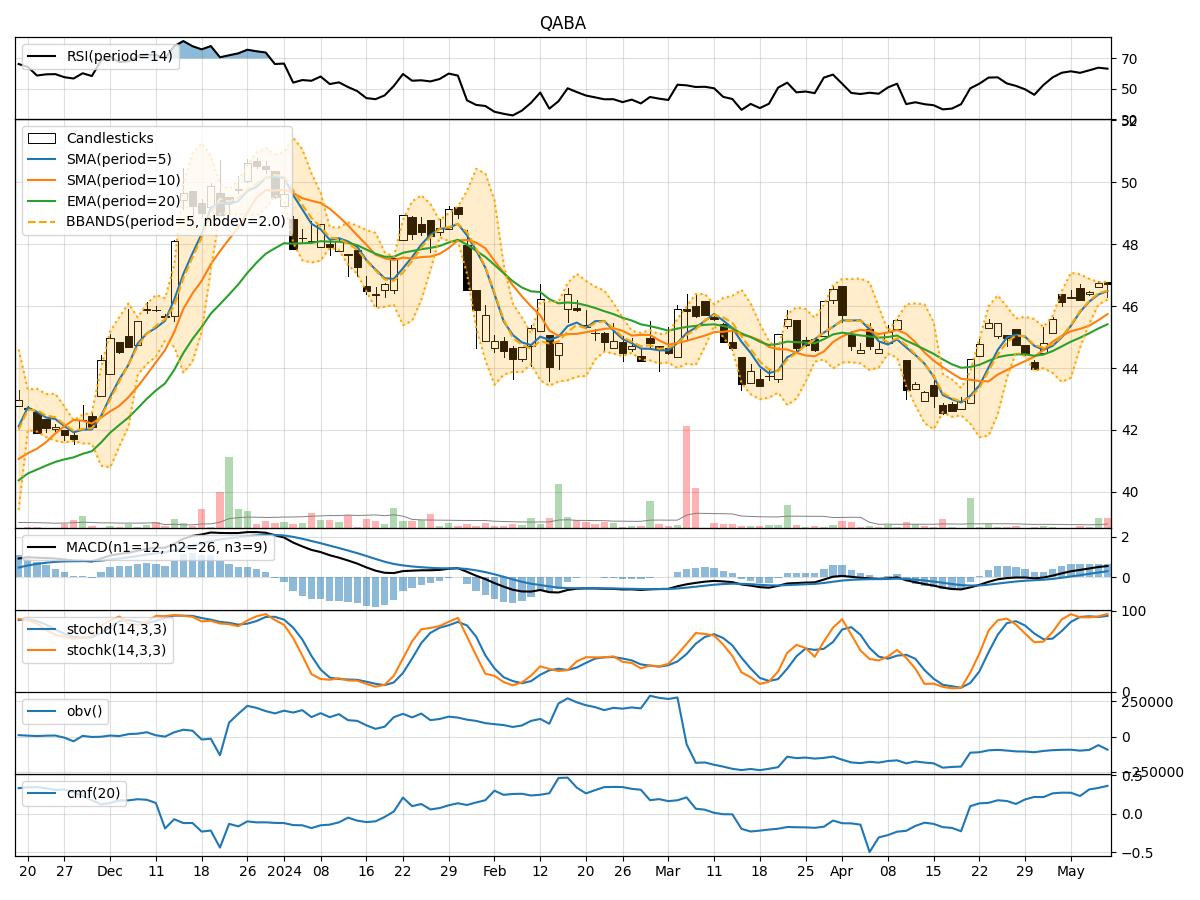
In analyzing the technical indicators for QABA over the last 5 days, we will delve into the trend, momentum, volatility, and volume indicators to provide a comprehensive outlook on the possible stock price movement in the coming days. By examining key metrics such as moving averages, MACD, RSI, Bollinger Bands, and OBV, we aim to offer valuable insights and predictions for potential price action.
Trend Analysis:
- Moving Averages (MA): The 5-day MA has been consistently above the closing prices, indicating a short-term uptrend.
- MACD: The MACD line has been trending upwards, with the MACD histogram also showing positive values, suggesting bullish momentum.
- EMA: The EMA(20) has been steadily increasing, reflecting a positive trend in the stock price.
Momentum Analysis:
- RSI: The RSI has been hovering around 60-65, indicating moderate strength in the recent price movements.
- Stochastic Oscillator: Both %K and %D have been in the overbought territory, suggesting a potential reversal or consolidation.
- Williams %R: The Williams %R is negative, signaling an oversold condition.
Volatility Analysis:
- Bollinger Bands: The stock price has been trading within the Bollinger Bands, with the bands narrowing, indicating reduced volatility.
- Bollinger %B: The %B indicator is around 0.7-0.9, suggesting the stock is trading closer to the upper band.
Volume Analysis:
- On-Balance Volume (OBV): The OBV has shown mixed signals, with some days seeing negative volume divergence.
- Chaikin Money Flow (CMF): The CMF has been positive, indicating buying pressure in the stock.
Conclusion:
Based on the analysis of the technical indicators, the stock of QABA is likely to experience a short-term consolidation phase. The moving averages and MACD suggest a bullish bias, while the momentum indicators point towards a potential reversal or sideways movement. The volatility indicators indicate reduced price fluctuations, possibly leading to a period of consolidation. The volume indicators show mixed signals but overall support the idea of a sideways trend.
Recommendation:
- Short-term Traders: Consider taking profits or reducing positions during consolidation.
- Long-term Investors: Monitor the price action for potential entry points or accumulation opportunities.
- Risk Management: Set stop-loss orders to protect gains and manage downside risk.
In conclusion, while the stock may exhibit some choppiness in the near term, the overall outlook remains neutral with a slight bullish bias. It is essential to monitor the price action closely and adjust strategies accordingly to navigate the market dynamics effectively.