Technical Analysis of QARP 2024-05-10
Overview:
In analyzing the provided QARP TA data for the last 5 days, we will delve into the technical indicators across trend, momentum, volatility, and volume to derive insights into the possible future stock price movement. By examining these indicators comprehensively, we aim to provide a well-informed prediction backed by data-driven analysis and expert interpretation.
Trend Analysis:
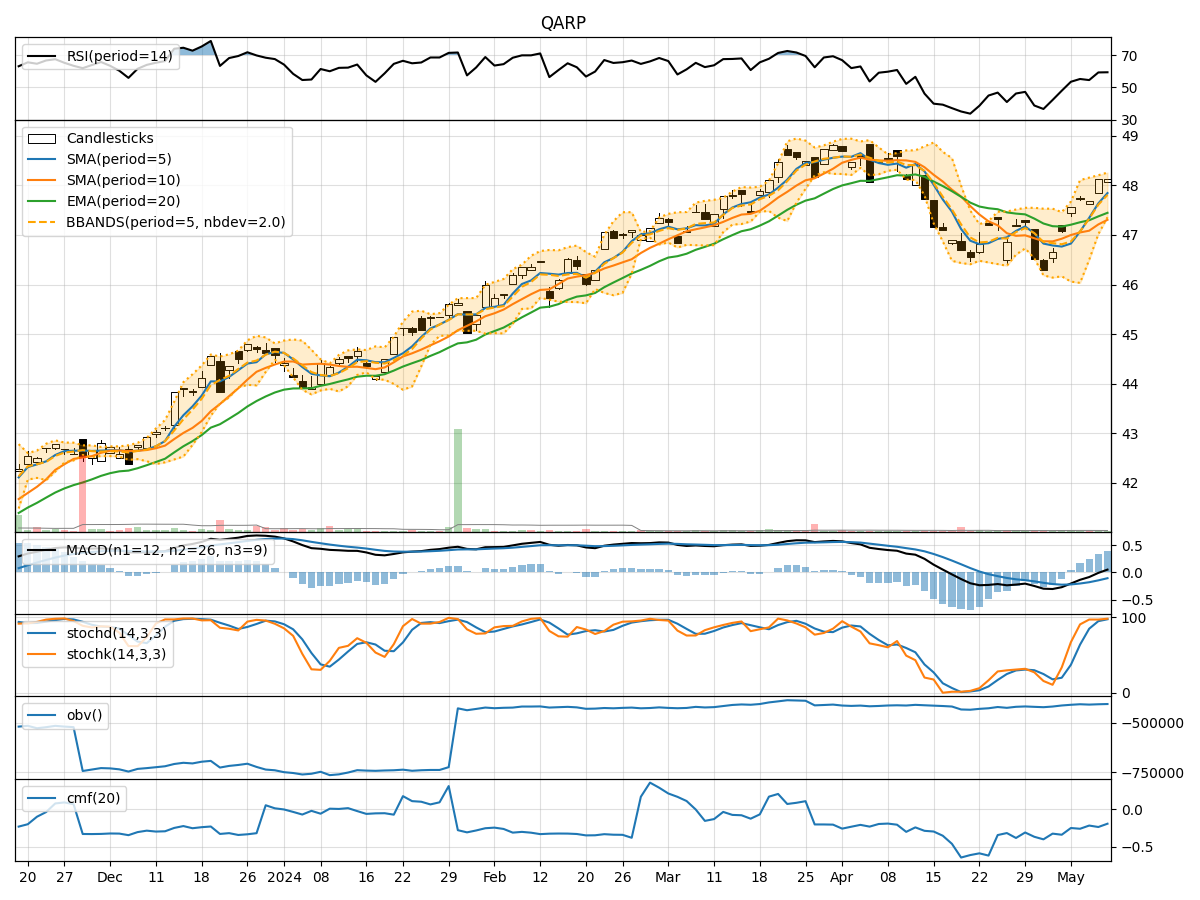
- Moving Averages (MA): The 5-day MA has been consistently above the closing prices, indicating a short-term uptrend.
- MACD: The MACD line has been trending upwards, with the MACD histogram showing positive values, suggesting bullish momentum.
- RSI: The RSI values have been fluctuating around the mid-level, indicating a balanced market sentiment.
Momentum Analysis:
- Stochastic Oscillator: Both %K and %D values have been in the overbought territory, signaling a potential reversal or consolidation.
- Williams %R: The Williams %R values have been hovering around the oversold region, suggesting a possible buying opportunity.
Volatility Analysis:
- Bollinger Bands (BB): The stock price has been trading within the bands, with the %B indicator showing a range-bound movement.
- Average True Range (ATR): The ATR values have been relatively stable, indicating consistent price movements.
Volume Analysis:
- On-Balance Volume (OBV): The OBV values have been fluctuating, reflecting mixed buying and selling pressure.
- Chaikin Money Flow (CMF): The CMF values have been negative, indicating a bearish money flow trend.
Key Observations:
- The trend indicators suggest a bullish bias in the short term.
- Momentum indicators show signs of potential overbought conditions.
- Volatility remains relatively stable, indicating a lack of significant price fluctuations.
- Volume indicators reflect mixed market participation and a bearish money flow trend.
Conclusion:
Based on the analysis of the technical indicators, the next few days' possible stock price movement could see further upside potential in the short term due to the bullish trend signals. However, caution is advised as momentum indicators indicate potential overbought conditions, which could lead to a temporary pullback or consolidation. Traders should closely monitor key support and resistance levels to navigate potential price fluctuations effectively. Overall, the outlook leans towards a bullish bias with a possibility of short-term consolidation before potential continuation of the uptrend.