Technical Analysis of QCLR 2024-05-10
Overview:
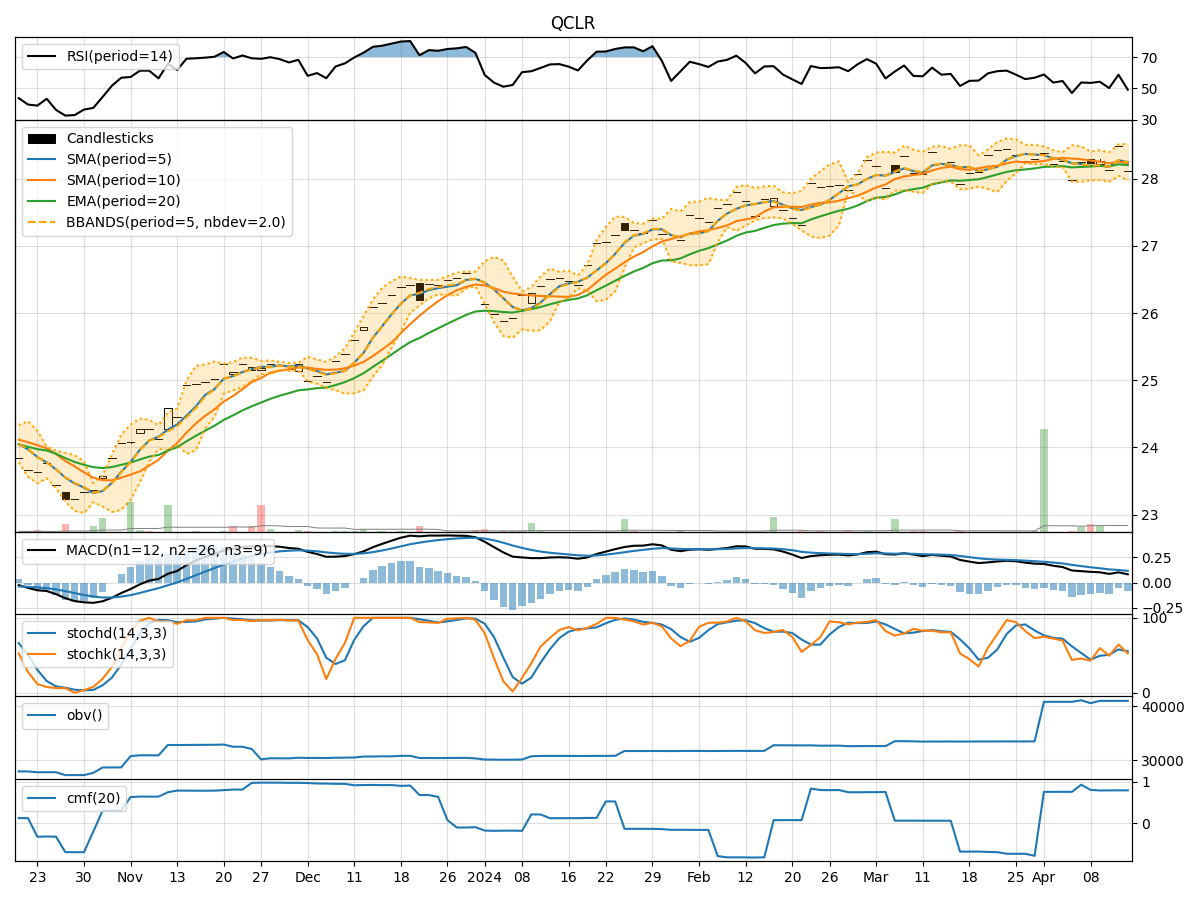
In analyzing the technical indicators for QCLR over the last 5 days, we will delve into the trend, momentum, volatility, and volume indicators to provide a comprehensive outlook on the possible stock price movement. By examining these key aspects, we aim to offer valuable insights and predictions for the upcoming days.
Trend Indicators:
- Moving Averages (MA): The 5-day MA has been consistently above the closing prices, indicating a bullish trend.
- MACD: The MACD line has been trending upwards, with the MACD histogram showing positive values, suggesting bullish momentum.
- EMA: The EMA has been steadily increasing, supporting the bullish trend.
Key Observation: The trend indicators point towards a bullish sentiment in the stock price movement.
Momentum Indicators:
- RSI: The RSI has been in the overbought territory, indicating strong buying momentum.
- Stochastic Oscillator: Both %K and %D have been consistently high, suggesting strong upward momentum.
- Williams %R: The indicator has been hovering around 0, indicating a potential reversal.
Key Observation: Momentum indicators reflect a strong bullish sentiment in the stock.
Volatility Indicators:
- Bollinger Bands: The bands have been narrowing, indicating decreasing volatility.
- Bollinger %B: The %B has been increasing, suggesting a potential breakout.
- Average True Range (ATR): ATR has been decreasing, indicating lower volatility.
Key Observation: Volatility indicators signal a potential breakout due to decreasing volatility.
Volume Indicators:
- On-Balance Volume (OBV): OBV has been increasing, indicating accumulation by investors.
- Chaikin Money Flow (CMF): CMF has been positive, suggesting buying pressure.
Key Observation: Volume indicators support the bullish sentiment in the stock.
Conclusion:
Based on the analysis of trend, momentum, volatility, and volume indicators, the overall outlook for QCLR is strongly bullish. The trend is positive, momentum is robust, volatility is decreasing, and volume is supportive of further price appreciation. Therefore, the next few days are likely to see an upward movement in the stock price.
Recommendation:
Considering the comprehensive analysis of technical indicators, it is advisable to consider buying QCLR in the upcoming days to capitalize on the anticipated bullish trend. Traders and investors may look for entry points during potential pullbacks for optimal risk-reward ratios.
Remember, while technical analysis provides valuable insights, it is essential to monitor market developments and risk factors that could impact the stock price movement.