Technical Analysis of QCON 2024-05-10
Overview:
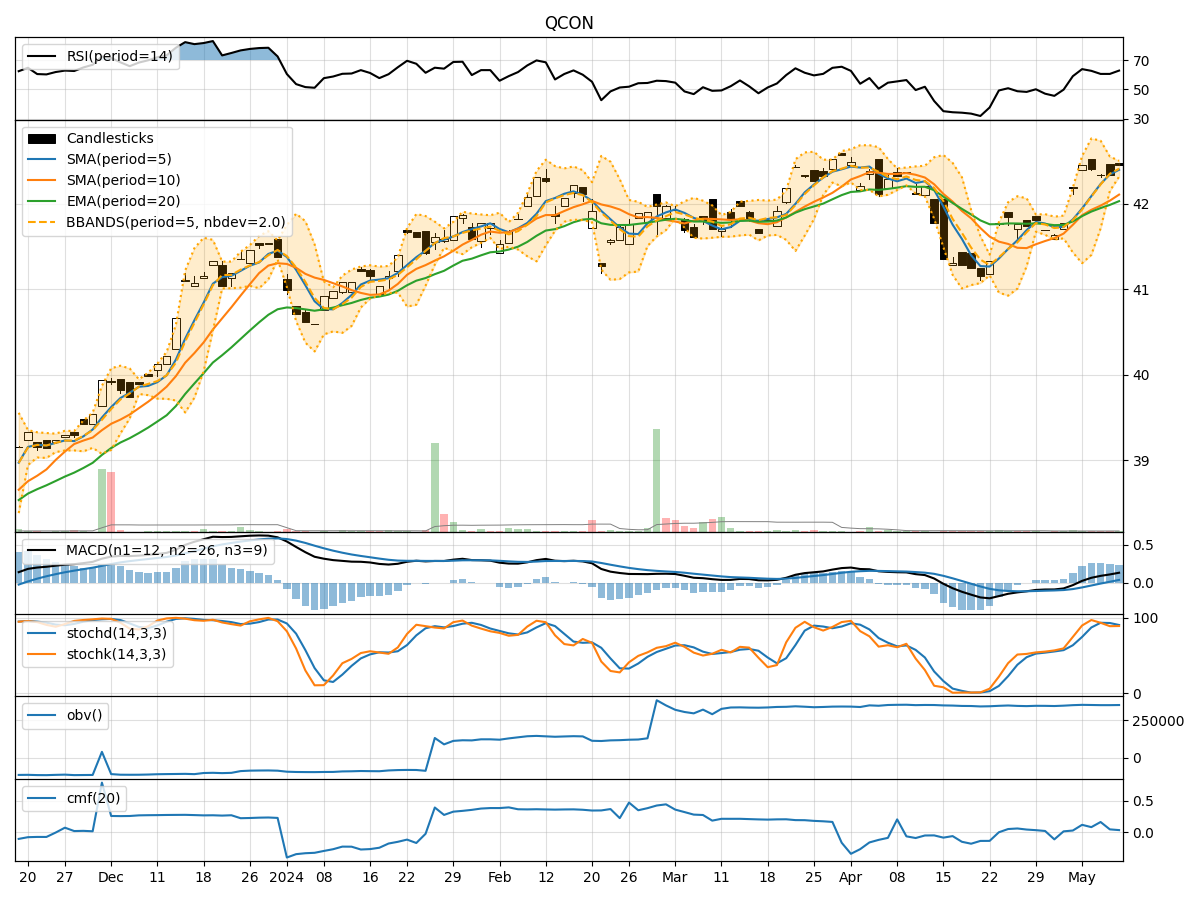
In analyzing the technical indicators for QCON stock over the last 5 days, we will delve into the trend, momentum, volatility, and volume indicators to provide a comprehensive outlook on the possible stock price movement in the coming days.
Trend Analysis:
- Moving Averages (MA): The 5-day Moving Average (MA) has been steadily increasing, indicating a positive trend in the stock price.
- MACD: The MACD line has been consistently above the signal line, suggesting bullish momentum in the stock.
- Relative Strength Index (RSI): The RSI has been fluctuating but generally staying within the neutral range, indicating a balanced buying and selling pressure.
Momentum Analysis:
- Stochastic Oscillator: The Stochastic Oscillator has been fluctuating but is currently in the overbought territory, signaling a potential reversal in the stock price.
- Williams %R (WillR): The Williams %R indicator has been hovering in the oversold region, suggesting a possible buying opportunity.
Volatility Analysis:
- Bollinger Bands (BB): The Bollinger Bands have been narrowing, indicating decreasing volatility in the stock price.
- Bollinger Band %B (BBP): The %B indicator is currently in the middle range, suggesting a neutral stance in terms of volatility.
Volume Analysis:
- On-Balance Volume (OBV): The OBV indicator has been relatively stable, indicating a balance between buying and selling pressure.
- Chaikin Money Flow (CMF): The CMF has been fluctuating but is generally positive, indicating a bullish money flow into the stock.
Key Observations:
- The trend indicators suggest a positive outlook for the stock price.
- Momentum indicators show conflicting signals with the Stochastic Oscillator in the overbought region and Williams %R in the oversold region.
- Volatility indicators point towards decreasing volatility in the stock.
- Volume indicators indicate a balanced buying and selling pressure.
Conclusion:
Based on the analysis of the technical indicators, the next few days' possible stock price movement for QCON is likely to be sideways with a slight upward bias. The trend is positive, but conflicting signals from momentum indicators may lead to a consolidation phase. Volatility is expected to remain low, and volume indicates a balanced market sentiment. Traders should exercise caution and wait for clearer signals before making significant trading decisions.