Technical Analysis of QDEC 2024-05-10
Overview:
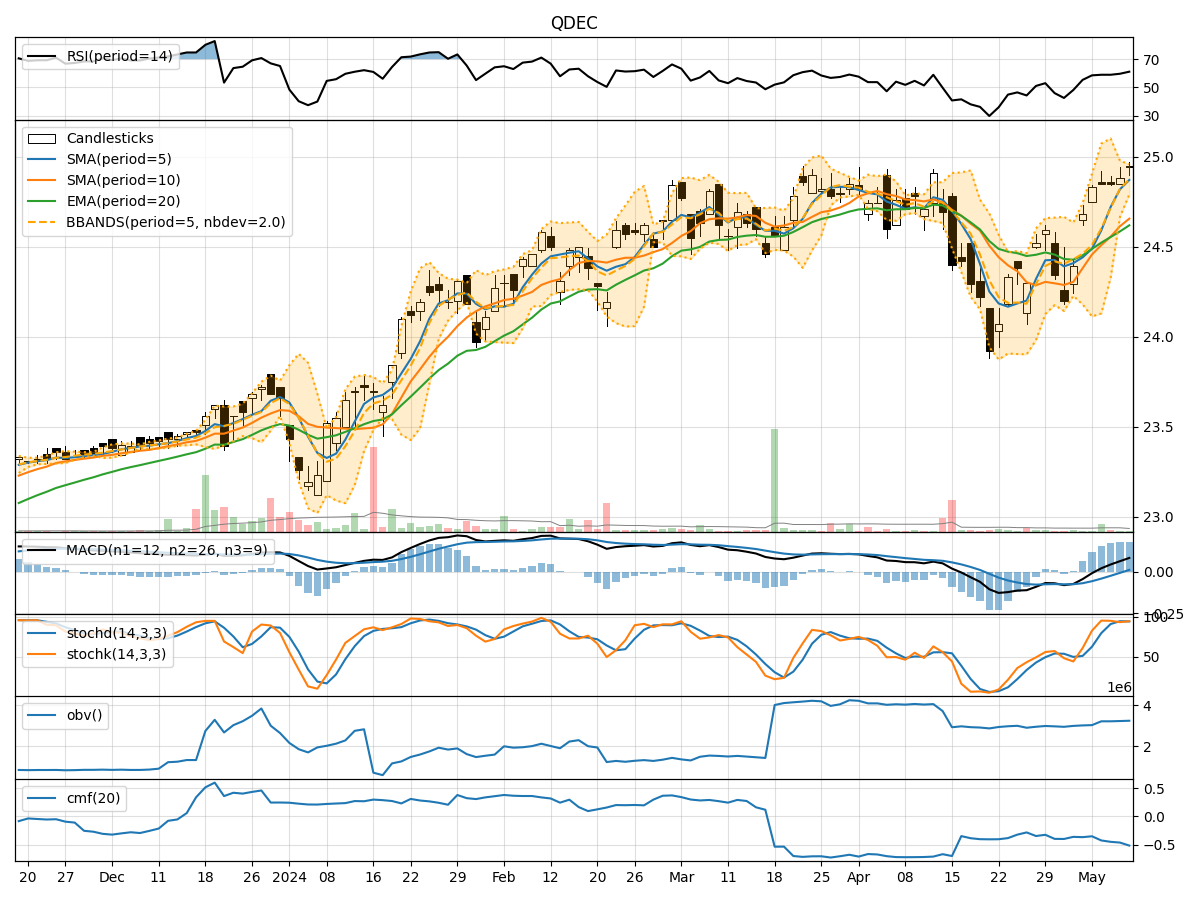
In analyzing the technical indicators for QDEC stock over the last 5 days, we will delve into the trend, momentum, volatility, and volume indicators to provide a comprehensive outlook on the possible stock price movement in the coming days. By examining these key indicators, we aim to offer valuable insights and predictions for informed decision-making.
Trend Analysis:
- Moving Averages (MA): The 5-day MA has been consistently above the closing prices, indicating a bullish trend.
- MACD: The MACD line has been above the signal line, suggesting a positive momentum in the stock price.
- EMA: The EMA has been trending upwards, reflecting a bullish sentiment in the market.
Key Observation: The trend indicators point towards an upward movement in the stock price.
Momentum Analysis:
- RSI: The RSI has been gradually increasing, indicating strengthening momentum.
- Stochastic Oscillator: Both %K and %D have been in the overbought zone, signaling a potential reversal.
- Williams %R: The Williams %R is in the oversold territory, suggesting a possible buying opportunity.
Key Observation: The momentum indicators suggest a mixed outlook with potential for a short-term correction.
Volatility Analysis:
- Bollinger Bands (BB): The stock price has been trading within the bands, indicating stable volatility.
- Bollinger %B: The %B is hovering around 1, suggesting the stock is trading close to the upper band.
Key Observation: Volatility indicators imply a sideways movement with a slight upward bias.
Volume Analysis:
- On-Balance Volume (OBV): The OBV has been relatively flat, indicating a balance between buying and selling pressure.
- Chaikin Money Flow (CMF): The CMF has been negative, suggesting outflow of money from the stock.
Key Observation: Volume indicators reflect a neutral sentiment with a slight bearish bias.
Conclusion:
Based on the analysis of trend, momentum, volatility, and volume indicators, the next few days' possible stock price movement for QDEC is likely to be upward in the short term, supported by the bullish trend and positive momentum. However, there might be a short-term correction indicated by the overbought levels in the stochastic oscillator. The volatility is expected to remain stable with a slight upward bias, while volume indicators suggest a neutral sentiment with a slight bearish bias.
Recommendation:
Considering the overall analysis, investors may consider buying on dips during potential corrections while maintaining a cautious approach due to the mixed signals from momentum indicators. It is essential to monitor the price action closely and set appropriate stop-loss levels to manage risk effectively. Additionally, staying informed about any market developments or news that could impact the stock price is crucial for making well-informed investment decisions.