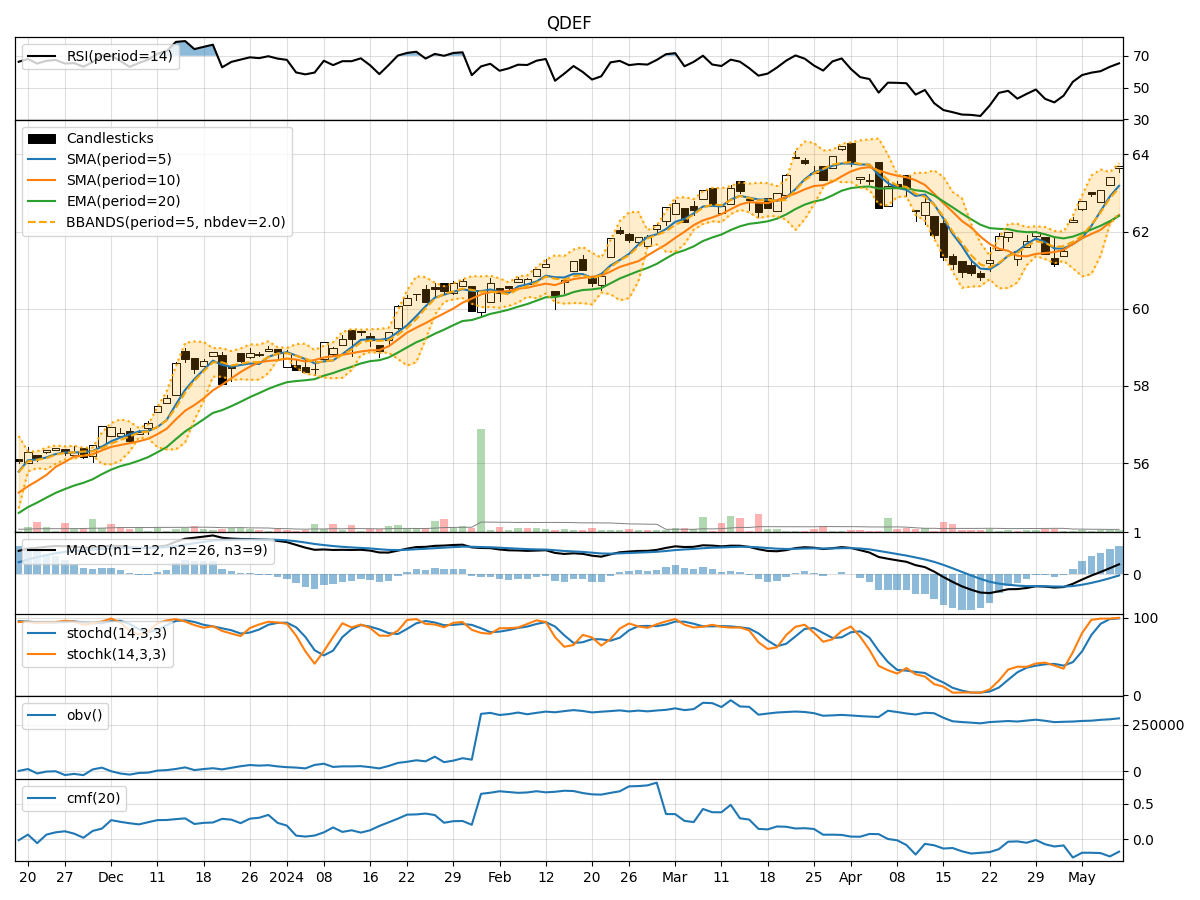
Technical Analysis of QDEF 2024-05-10
Overview:
In analyzing the technical indicators for QDEF over the last 5 days, we will delve into the trend, momentum, volatility, and volume indicators to provide a comprehensive outlook on the possible stock price movement in the coming days.
Trend Indicators:
- Moving Averages (MA): The 5-day MA has been consistently above the 10-day SMA, indicating a short-term bullish trend.
- MACD: The MACD line has been consistently above the signal line, suggesting a bullish momentum.
- EMA: The EMA has been trending upwards, supporting the bullish sentiment in the short to medium term.
Momentum Indicators:
- RSI: The RSI has been increasing and is currently in the overbought territory, signaling a strong bullish momentum.
- Stochastic Oscillator: Both %K and %D have been in the overbought zone, indicating a strong bullish momentum.
- Williams %R: The indicator is at 0, suggesting a potential reversal or consolidation.
Volatility Indicators:
- Bollinger Bands (BB): The stock price has been trading near the upper Bollinger Band, indicating high volatility and a potential overbought condition.
- Bollinger Band Width: The BB Width has been narrowing, suggesting a potential decrease in volatility.
Volume Indicators:
- On-Balance Volume (OBV): The OBV has been declining, indicating a decrease in buying pressure.
- Chaikin Money Flow (CMF): The CMF has been negative, suggesting a bearish money flow.
Key Observations and Opinions:
- Trend: The trend indicators suggest a strong bullish sentiment in the short to medium term.
- Momentum: Momentum indicators indicate a strong bullish momentum, but the Williams %R suggests a potential reversal or consolidation.
- Volatility: High volatility near the upper Bollinger Band indicates a potential overbought condition.
- Volume: Declining OBV and negative CMF signal weakening buying pressure and bearish money flow.
Conclusion:
Based on the analysis of the technical indicators, the next few days' possible stock price movement for QDEF is likely to be sideways to slightly bearish. The strong bullish trend and momentum may face resistance near the overbought levels, potentially leading to a consolidation phase or a slight pullback. Traders should exercise caution and consider taking profits or implementing risk management strategies in anticipation of a possible correction.