Technical Analysis of QDIV 2024-05-10
Overview:
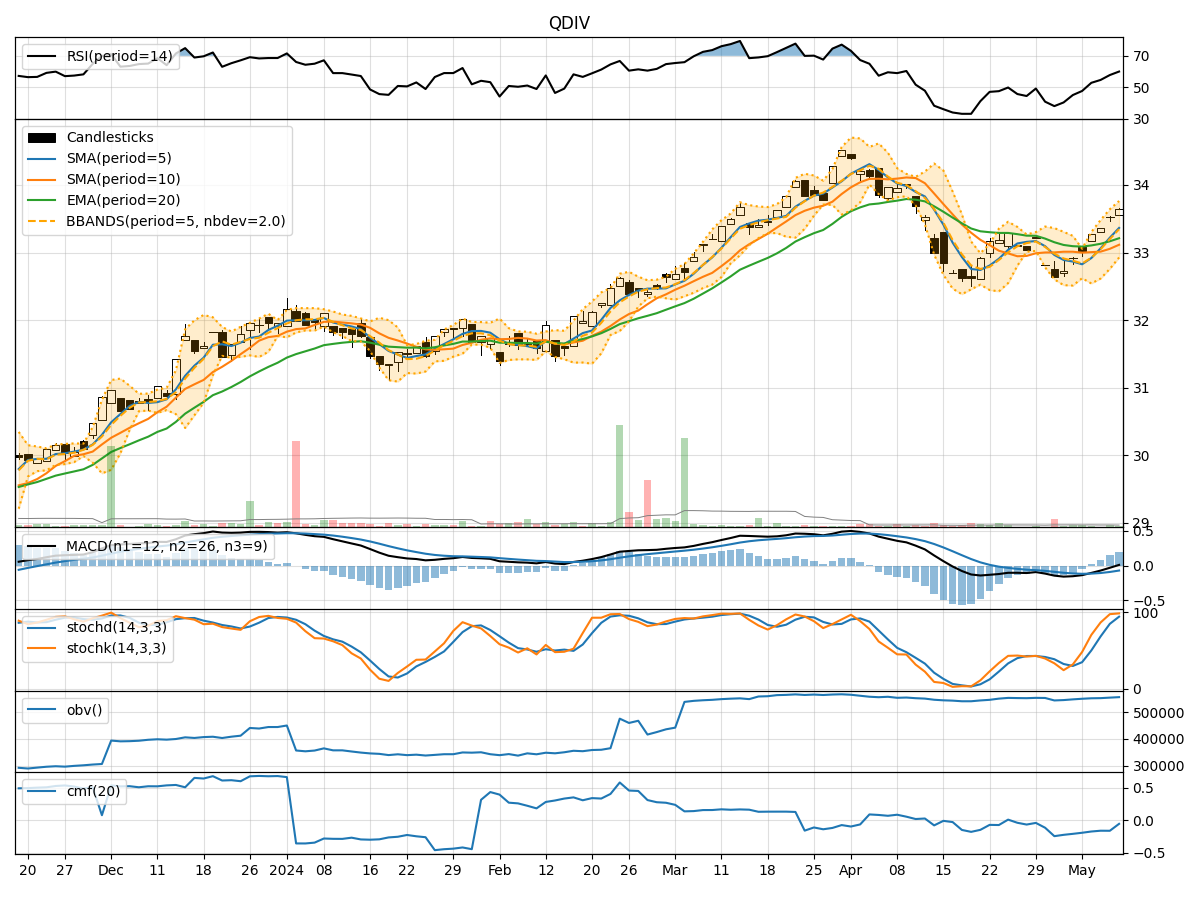
In analyzing the technical indicators for QDIV over the last 5 days, we will delve into the trend, momentum, volatility, and volume indicators to provide a comprehensive outlook on the possible stock price movement in the coming days.
Trend Indicators:
- Moving Averages (MA): The 5-day MA has been trending above the closing prices, indicating a short-term uptrend.
- MACD: The MACD line has been consistently above the signal line, suggesting bullish momentum.
- EMA: The EMA has been steadily increasing, reflecting a positive trend.
Key Observation: The trend indicators point towards a bullish sentiment in the stock price movement.
Momentum Indicators:
- RSI: The RSI has been gradually increasing, indicating strengthening momentum.
- Stochastic Oscillator: Both %K and %D have been in the overbought zone, suggesting a potential reversal.
- Williams %R: The indicator has been hovering near the oversold territory, signaling a possible buying opportunity.
Key Observation: Momentum indicators show a mixed signal with potential for a short-term correction.
Volatility Indicators:
- Bollinger Bands: The stock price has been trading within the bands, indicating normal volatility.
- Bollinger %B: The %B indicator has been fluctuating within the bands, reflecting price consolidation.
Key Observation: Volatility indicators suggest a sideways movement in the stock price.
Volume Indicators:
- On-Balance Volume (OBV): The OBV has been gradually increasing, indicating accumulation.
- Chaikin Money Flow (CMF): The CMF has been negative, suggesting selling pressure.
Key Observation: Volume indicators show a neutral to slightly bearish sentiment.
Conclusion:
Based on the analysis of the technical indicators, the stock of QDIV is likely to experience mixed price movements in the next few days. The trend indicators signal a bullish sentiment, while momentum indicators hint at a potential short-term correction. Volatility indicators suggest sideways movement, and volume indicators show a neutral to slightly bearish outlook.
Recommendation:
- Short-term Traders: Consider taking profits as the stock may experience a correction based on momentum indicators.
- Long-term Investors: Hold positions as the overall trend remains bullish according to trend indicators.
Overall View: The stock is likely to consolidate in the near term with a potential for a short-term correction before resuming its bullish trend.
Key Conclusion: The stock price of QDIV is expected to undergo a consolidation phase with a short-term correction before potentially resuming its bullish trajectory.