Technical Analysis of QDPL 2024-05-10
Overview:
In analyzing the technical indicators for QDPL stock over the last 5 days, we will delve into the trend, momentum, volatility, and volume indicators to provide a comprehensive outlook on the possible future stock price movement. By examining these key indicators, we aim to offer valuable insights and predictions for the upcoming trading days.
Trend Analysis:
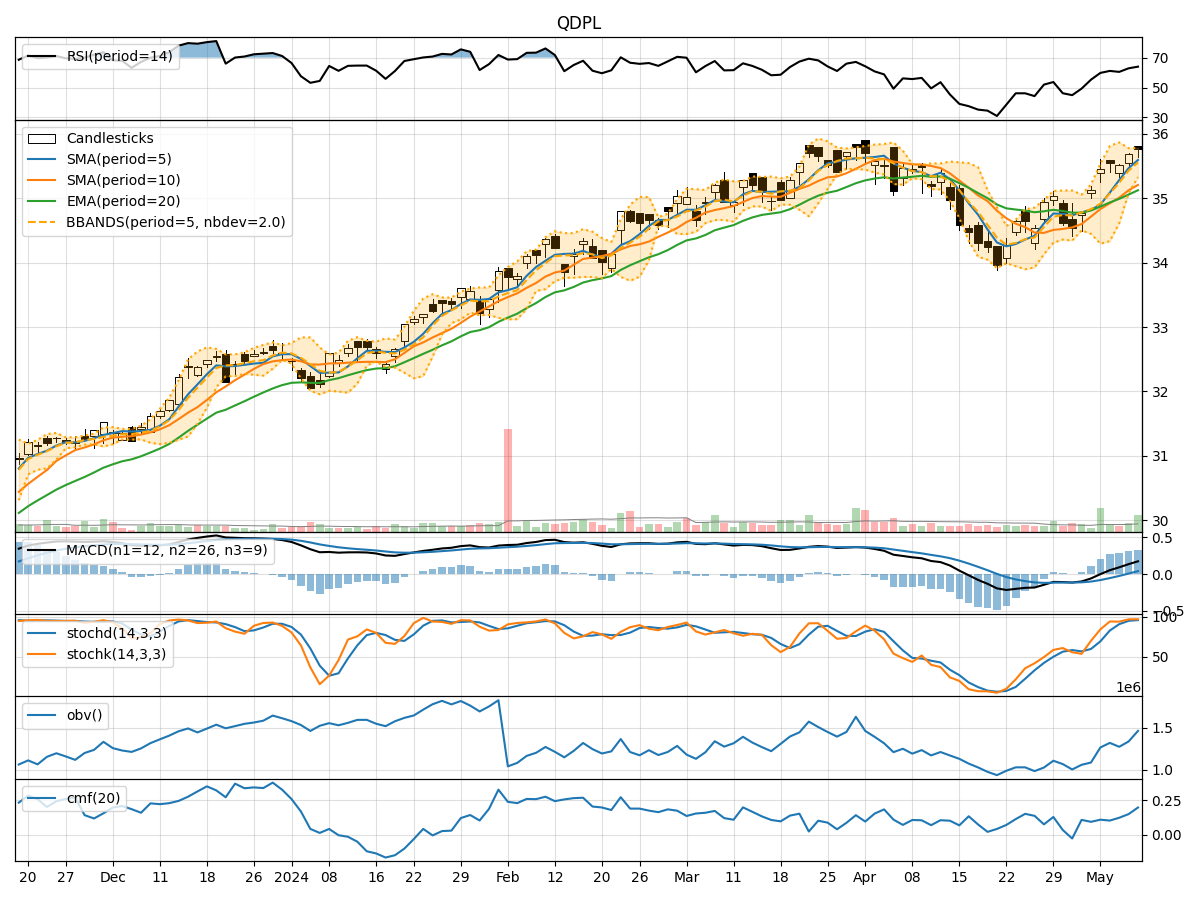
- Moving Averages (MA): The 5-day Moving Average (MA) has been consistently rising, indicating a bullish trend in the short term.
- MACD: The MACD line has been above the signal line for the past 5 days, suggesting positive momentum in the stock price.
- EMA: The Exponential Moving Average (EMA) has also been trending upwards, supporting the bullish sentiment in the stock.
Momentum Analysis:
- RSI: The Relative Strength Index (RSI) has been increasing, showing strengthening momentum in the stock.
- Stochastic Oscillator: Both %K and %D lines of the Stochastic Oscillator are in the overbought zone, indicating a potential reversal or consolidation.
- Williams %R: The Williams %R is in the oversold territory, suggesting a possible upcoming bounce in the stock price.
Volatility Analysis:
- Bollinger Bands (BB): The Bollinger Bands have been narrowing, indicating decreasing volatility in the stock.
- Bollinger %B: The %B indicator is hovering around 0.8, suggesting the stock is trading near the upper band.
- Average True Range (ATR): The ATR has been decreasing, signifying a reduction in price volatility.
Volume Analysis:
- On-Balance Volume (OBV): The OBV has been steadily increasing, indicating strong buying pressure in the stock.
- Chaikin Money Flow (CMF): The CMF is positive, reflecting a healthy inflow of money into the stock.
Key Observations:
- The trend indicators suggest a bullish sentiment in the stock, supported by rising moving averages and positive MACD.
- Momentum indicators show mixed signals with RSI indicating strength, while Stochastic Oscillator and Williams %R hint at potential reversals.
- Volatility indicators point towards decreasing volatility, which could lead to a period of consolidation.
- Volume indicators indicate strong buying pressure and positive money flow into the stock.
Conclusion:
Based on the analysis of the technical indicators, the next few days' possible stock price movement for QDPL is likely to be upward with a potential for consolidation. The bullish trend supported by moving averages and MACD, coupled with strong buying pressure indicated by volume indicators, suggests a positive outlook for the stock. However, caution is advised as the Stochastic Oscillator and Williams %R signal potential reversals, indicating the need for monitoring for any signs of a pullback. Overall, the stock is poised for further upside potential in the near term.