Technical Analysis of QEMM 2024-05-10
Overview:
In analyzing the technical indicators for QEMM stock over the last 5 days, we will delve into the trends, momentum, volatility, and volume indicators to provide a comprehensive outlook on the possible stock price movement in the coming days. By examining these key indicators, we aim to offer valuable insights and predictions for informed decision-making.
Trend Indicators:
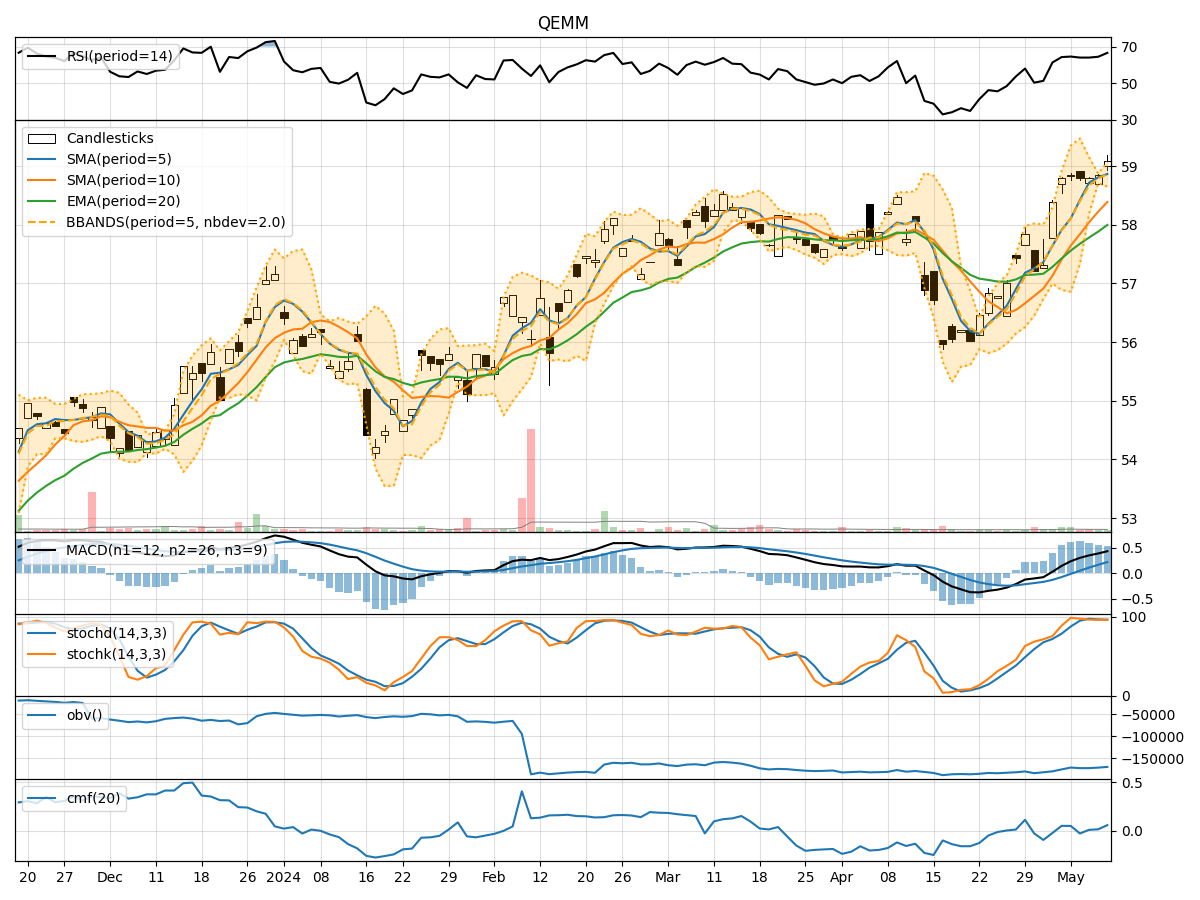
- Moving Averages (MA): The 5-day Moving Average (MA) has been consistently above the Simple Moving Average (SMA) and Exponential Moving Average (EMA), indicating a bullish trend.
- MACD: The MACD line has been consistently above the signal line, with both lines showing an upward trend, suggesting bullish momentum.
- MACD Histogram: The MACD Histogram has been increasing over the last 5 days, indicating strengthening bullish momentum.
Momentum Indicators:
- RSI: The Relative Strength Index (RSI) has been in the overbought territory but has shown a slight decrease, suggesting a potential cooling off of the overbought conditions.
- Stochastic Oscillator: Both %K and %D lines of the Stochastic Oscillator have been in the overbought zone, indicating a strong bullish momentum.
- Williams %R: The Williams %R has been in the oversold region, indicating a potential reversal in the short term.
Volatility Indicators:
- Bollinger Bands: The stock price has been trading within the Bollinger Bands, with the bands narrowing slightly, indicating a period of consolidation.
- Bollinger %B: The %B indicator has been hovering around 1, suggesting that the stock price is at the upper band, potentially signaling an overbought condition.
Volume Indicators:
- On-Balance Volume (OBV): The OBV has shown a slight decrease over the last 5 days, indicating some distribution happening in the stock.
- Chaikin Money Flow (CMF): The CMF has been positive, indicating buying pressure in the stock over the analyzed period.
Key Observations and Opinions:
- Trend: The trend indicators suggest a strong bullish sentiment in the stock.
- Momentum: The momentum indicators indicate a strong bullish momentum, albeit with some signs of potential reversal.
- Volatility: The volatility indicators point towards a period of consolidation in the stock price.
- Volume: The volume indicators show a slight decrease in buying pressure but overall positive sentiment.
Conclusion:
Based on the analysis of the technical indicators, the stock of QEMM is likely to experience continued upward movement in the coming days, supported by the bullish trend and momentum. However, caution is advised as some indicators hint at potential overbought conditions and a need for a short-term correction. Traders should closely monitor the price action and key support levels to make informed decisions.