Technical Analysis of QFLR 2024-05-10
Overview:
In analyzing the provided QFLR TA data for the last 5 days, we will delve into the technical indicators across trend, momentum, volatility, and volume to derive insights into the possible future stock price movement. By examining key metrics and patterns, we aim to provide a comprehensive analysis and make informed predictions.
Trend Analysis:
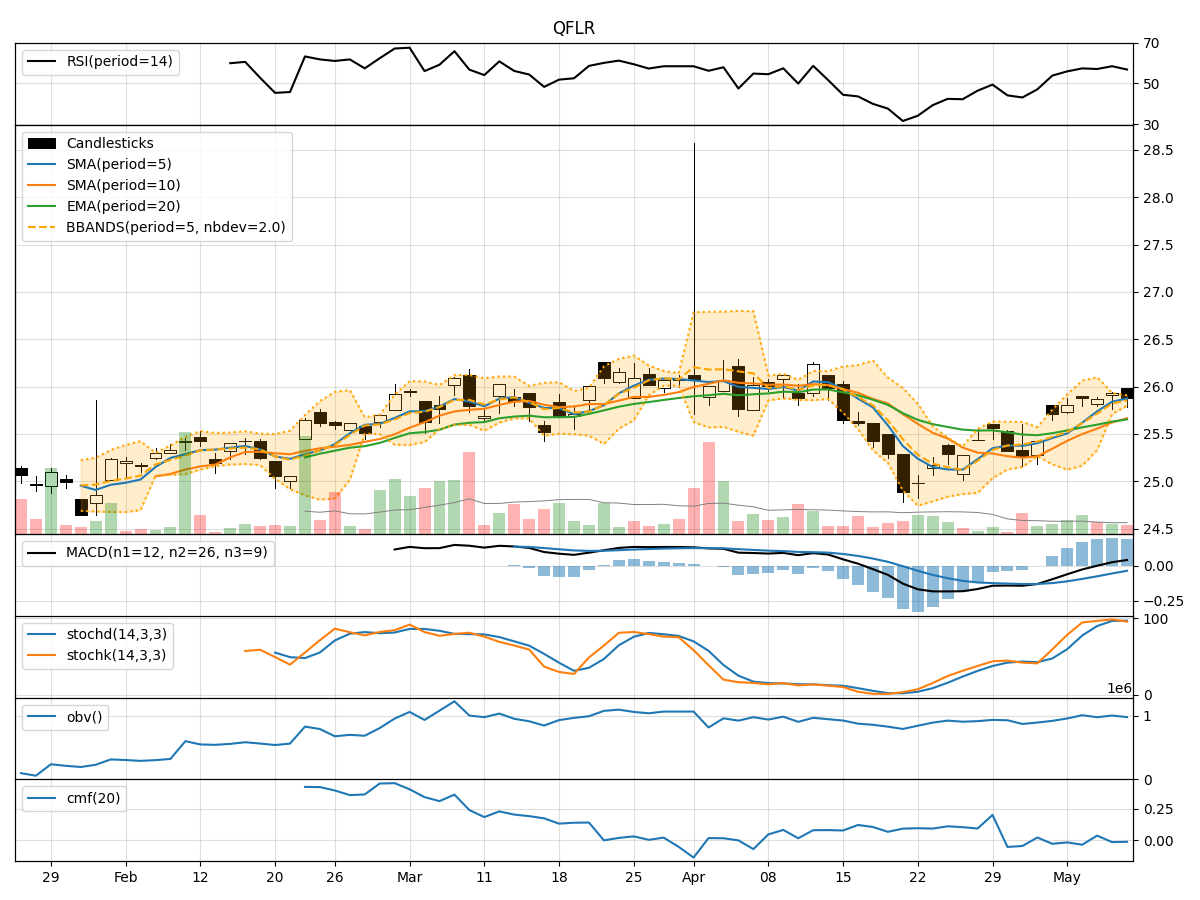
- Moving Averages (MA): The 5-day MA has been consistently above the closing prices, indicating a bullish trend.
- MACD: The MACD line has been positive, with the MACD histogram showing an uptrend, suggesting bullish momentum.
- RSI: The RSI values have been fluctuating around the neutral zone, indicating a lack of strong trend direction.
Momentum Analysis:
- Stochastic Oscillator: Both %K and %D values have been in the overbought zone, suggesting a potential reversal or consolidation.
- Williams %R: The Williams %R values have been fluctuating, indicating indecision in momentum direction.
Volatility Analysis:
- Bollinger Bands (BB): The stock price has been trading within the bands, with the %B indicator showing price nearing the upper band, signaling potential overbought conditions.
- Average True Range (ATR): ATR values have been relatively stable, indicating consistent volatility levels.
Volume Analysis:
- On-Balance Volume (OBV): The OBV has shown mixed movements, suggesting uncertainty in the buying and selling pressure.
- Chaikin Money Flow (CMF): The CMF has been fluctuating around the zero line, indicating a balance between buying and selling pressure.
Key Observations:
- The trend indicators suggest a bullish bias, supported by positive MACD and MA trends.
- Momentum indicators show signs of overbought conditions, potentially leading to a reversal or consolidation.
- Volatility remains relatively stable, with the price nearing the upper Bollinger Band, indicating a possible overbought scenario.
- Volume indicators reflect mixed signals, highlighting uncertainty in market participation.
Conclusion:
Based on the analysis of the technical indicators, the stock price is likely to experience a short-term consolidation or pullback due to overbought momentum levels and potential profit-taking activities. Traders should exercise caution and consider waiting for clearer signals before making significant trading decisions. A short-term downward correction or sideways movement is probable in the coming days.