Technical Analysis of QGRO 2024-05-10
Overview:
In analyzing the technical indicators for QGRO over the last 5 days, we will delve into the trend, momentum, volatility, and volume indicators to provide a comprehensive outlook on the possible stock price movement in the coming days. By examining these key aspects, we aim to offer valuable insights and predictions for informed decision-making.
Trend Analysis:
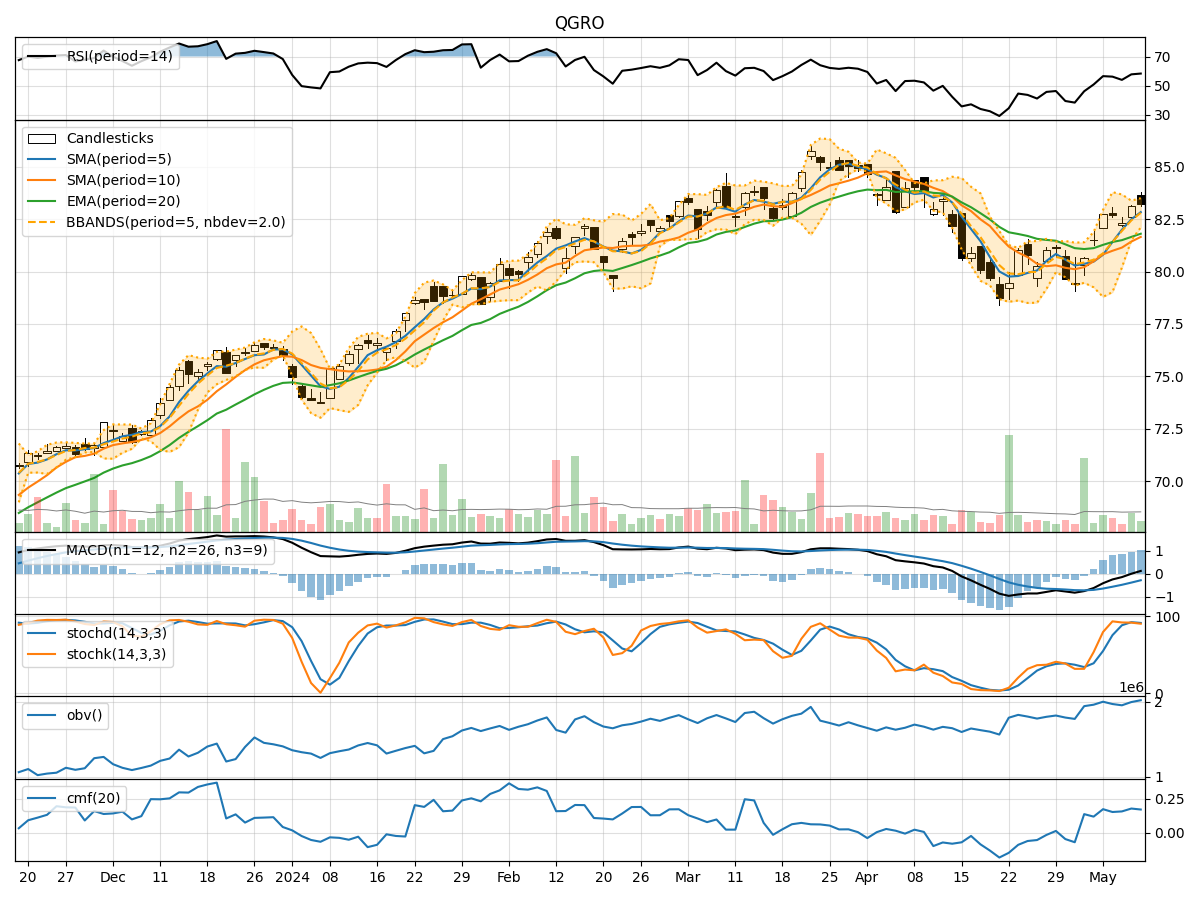
- Moving Averages (MA): The 5-day Moving Average (MA) has been consistently above the Simple Moving Average (SMA) and Exponential Moving Average (EMA), indicating a bullish trend.
- MACD: The MACD line has been above the signal line, with both lines showing an upward trend, suggesting bullish momentum.
- MACD Histogram: The MACD Histogram has been increasing, indicating strengthening bullish momentum.
Momentum Analysis:
- RSI: The Relative Strength Index (RSI) has been fluctuating around the 50 level, indicating a neutral momentum.
- Stochastic Oscillator: Both %K and %D lines have been in the overbought zone, suggesting a potential reversal or consolidation.
- Williams %R: The Williams %R has been fluctuating around the oversold and overbought levels, indicating mixed momentum signals.
Volatility Analysis:
- Bollinger Bands: The stock price has been trading within the Bollinger Bands, with the bands narrowing, suggesting a potential decrease in volatility.
- Bollinger %B: The %B indicator has been hovering around 0.8, indicating that the stock is trading near the upper band.
Volume Analysis:
- On-Balance Volume (OBV): The OBV has shown a slight increase over the last 5 days, indicating some accumulation.
- Chaikin Money Flow (CMF): The CMF has been positive, suggesting buying pressure in the stock.
Key Observations and Opinions:
- Trend: The trend indicators suggest a strong bullish sentiment in the stock.
- Momentum: The momentum indicators show mixed signals, with a potential for a reversal or consolidation.
- Volatility: The narrowing Bollinger Bands indicate decreasing volatility in the stock.
- Volume: The slight increase in OBV and positive CMF suggest some buying interest in the stock.
Conclusion:
Based on the analysis of the technical indicators, the stock of QGRO is likely to continue its upward movement in the coming days. The bullish trend, supported by the MACD and moving averages, indicates a positive outlook. However, caution is advised due to mixed signals from momentum indicators like RSI and Stochastic Oscillator, which suggest a possible consolidation or reversal. Overall, the stock is expected to maintain its bullish bias with potential short-term fluctuations.