Technical Analysis of QINT 2024-05-10
Overview:
In analyzing the technical indicators for QINT over the last 5 days, we will delve into the trend, momentum, volatility, and volume indicators to provide a comprehensive outlook on the possible stock price movement. By examining these key aspects, we aim to offer valuable insights and predictions for the upcoming days.
Trend Analysis:
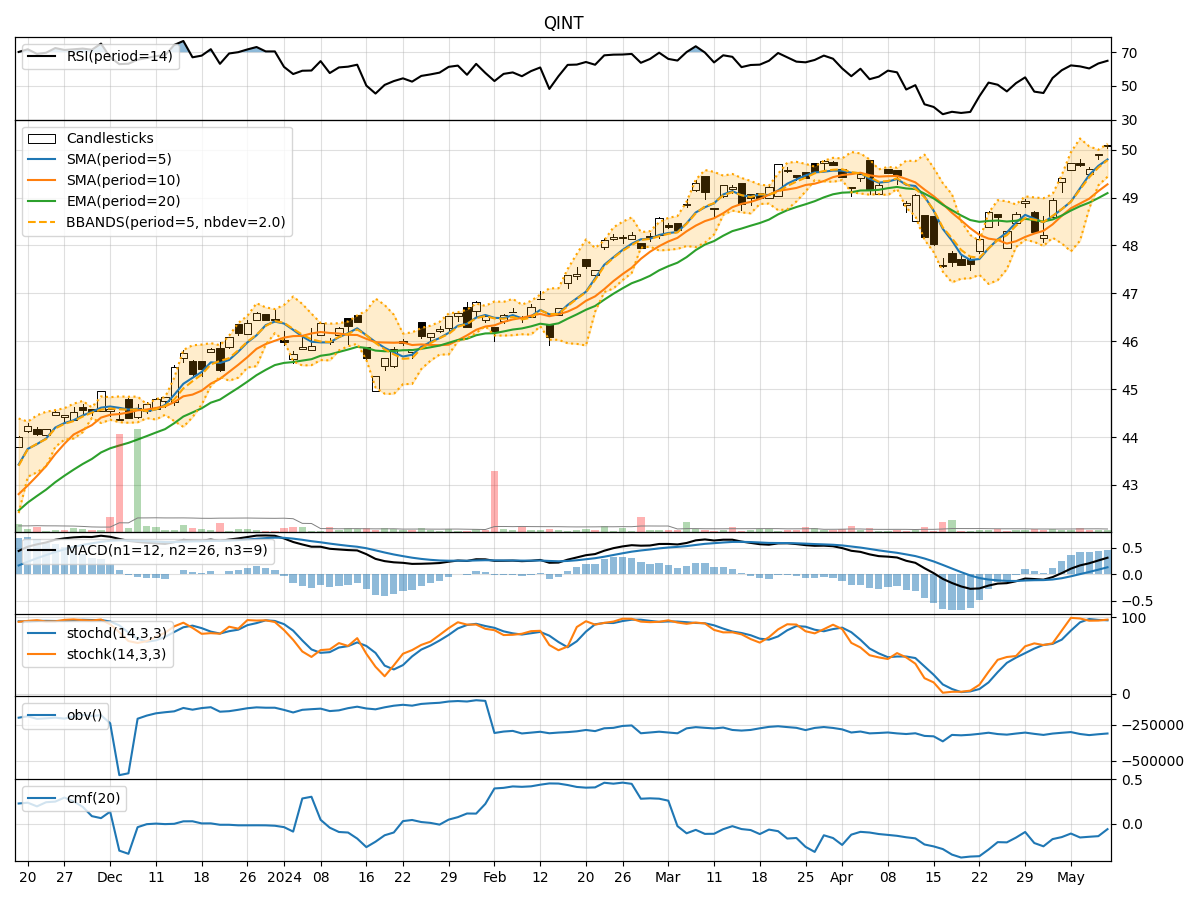
- Moving Averages (MA): The 5-day Moving Average (MA) has been consistently rising, indicating a bullish trend in the short term.
- MACD: The MACD line has been increasing, crossing above the signal line, suggesting a bullish momentum.
- EMA: The Exponential Moving Average (EMA) has been trending upwards, supporting the bullish sentiment.
Momentum Analysis:
- RSI: The Relative Strength Index (RSI) has been in the overbought territory, indicating a strong bullish momentum.
- Stochastic Oscillator: Both %K and %D have been relatively high, signaling a strong buying pressure.
- Williams %R: The indicator has been hovering in the oversold region, suggesting a potential reversal to the upside.
Volatility Analysis:
- Bollinger Bands (BB): The bands have been widening, indicating increased volatility in the stock price.
- BB %B: The %B indicator has been fluctuating within a moderate range, reflecting the volatility in the stock.
Volume Analysis:
- On-Balance Volume (OBV): The OBV has shown mixed signals, with fluctuations in volume accumulation.
- Chaikin Money Flow (CMF): The CMF has been negative, indicating a slight distribution phase.
Key Observations:
- The trend indicators suggest a strong bullish sentiment in the short term.
- Momentum indicators point towards a continuation of the bullish momentum.
- Volatility has increased, potentially leading to larger price swings.
- Volume indicators show mixed signals, with no clear trend in volume accumulation.
Conclusion:
Based on the analysis of the technical indicators, the next few days for QINT are likely to see continued upward movement in the stock price. The bullish trend, supported by positive momentum and increasing volatility, indicates a favorable outlook for potential price appreciation. Traders and investors may consider buying opportunities in anticipation of further price gains. It is essential to monitor the indicators closely for any signs of reversal or consolidation in the coming days.