Technical Analysis of QIS 2024-05-10
Overview:
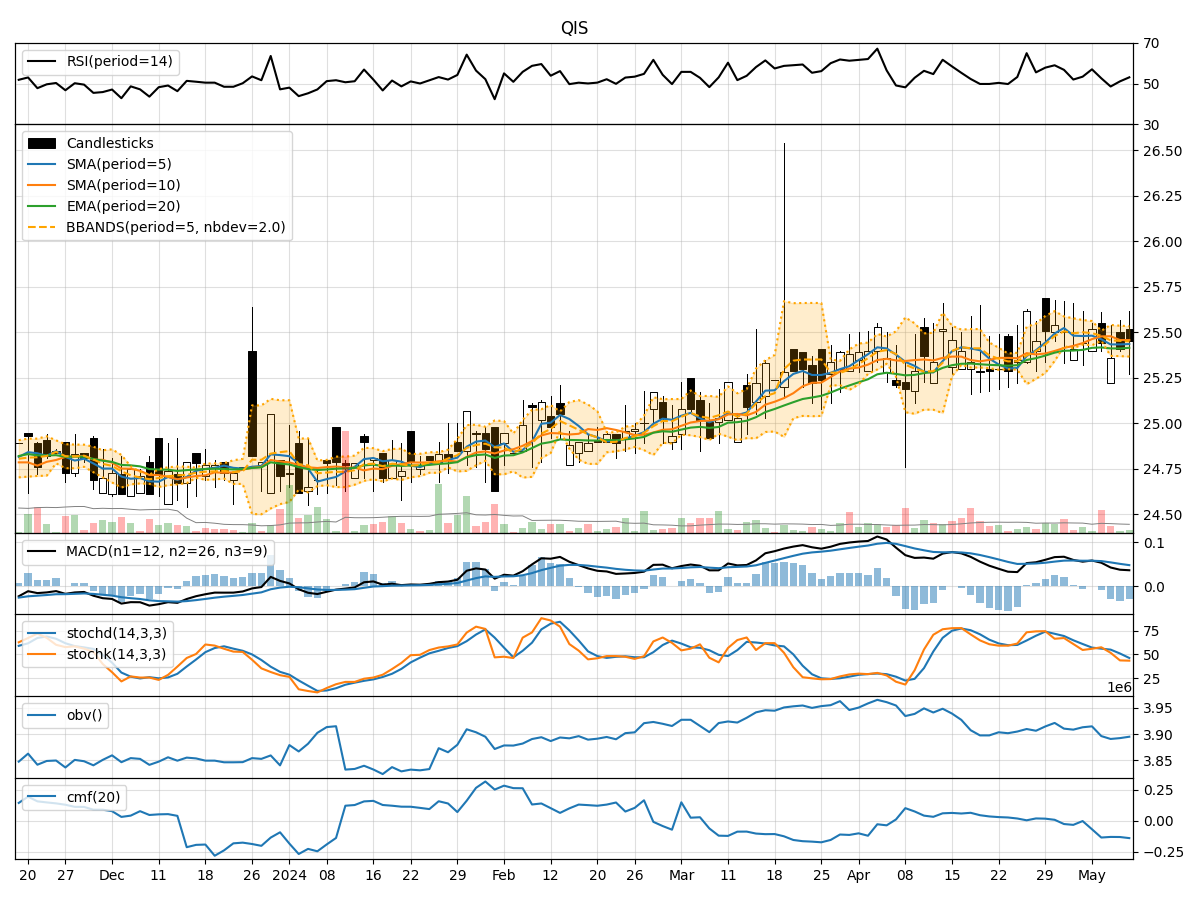
In analyzing the provided Technical Analysis (TA) data for the last 5 days, we will delve into the trend, momentum, volatility, and volume indicators to derive insights into the possible future stock price movement. By examining these key indicators, we aim to provide a comprehensive and informed prediction for the upcoming days.
Trend Indicators:
- Moving Averages (MA): The moving averages show a slight decline over the last 5 days, indicating a weakening trend.
- MACD (Moving Average Convergence Divergence): The MACD and signal line have been decreasing, suggesting a bearish momentum.
- EMA (Exponential Moving Average): The EMA has also been trending downwards, aligning with the MA and MACD indicators.
Momentum Indicators:
- RSI (Relative Strength Index): The RSI has been fluctuating around the mid-level, indicating a lack of strong momentum in either direction.
- Stochastic Oscillator: Both %K and %D have been decreasing, signaling a potential bearish momentum.
- Williams %R (Willams Percentage Range): The Williams %R is hovering in the oversold territory, suggesting a possible reversal.
Volatility Indicators:
- Bollinger Bands (BB): The Bollinger Bands have been narrowing, indicating decreasing volatility in the stock price.
- BB% (Bollinger Bands Percentage): The BB% has been decreasing, reflecting the tightening of price movements.
- BB Width: The BB Width has been contracting, suggesting a period of consolidation and potential breakout.
Volume Indicators:
- On-Balance Volume (OBV): The OBV has shown mixed movements, indicating indecision among market participants.
- Chaikin Money Flow (CMF): The CMF has been negative, suggesting selling pressure in the stock.
Key Observations and Opinions:
- Trend: The overall trend is bearish based on the moving averages and MACD indicators.
- Momentum: Momentum indicators are mixed, with a slight bearish bias indicated by the Stochastic Oscillator.
- Volatility: Volatility has been decreasing, pointing towards a period of consolidation.
- Volume: Volume indicators suggest a lack of strong buying interest, with selling pressure indicated by the CMF.
Conclusion:
Based on the analysis of the technical indicators, the stock price is likely to experience further downward movement in the next few days. The bearish trend, coupled with weakening momentum and decreasing volatility, indicates a potential continuation of the current downtrend. Traders and investors should exercise caution and consider short-term selling strategies or wait for a clear reversal signal before considering long positions.