Technical Analysis of QLTY 2024-05-10
Overview:
In analyzing the technical indicators for QLTY stock over the last 5 days, we will delve into the trend, momentum, volatility, and volume indicators to provide a comprehensive outlook on the possible future stock price movement. By examining these key indicators, we aim to offer valuable insights and recommendations for potential investors.
Trend Analysis:
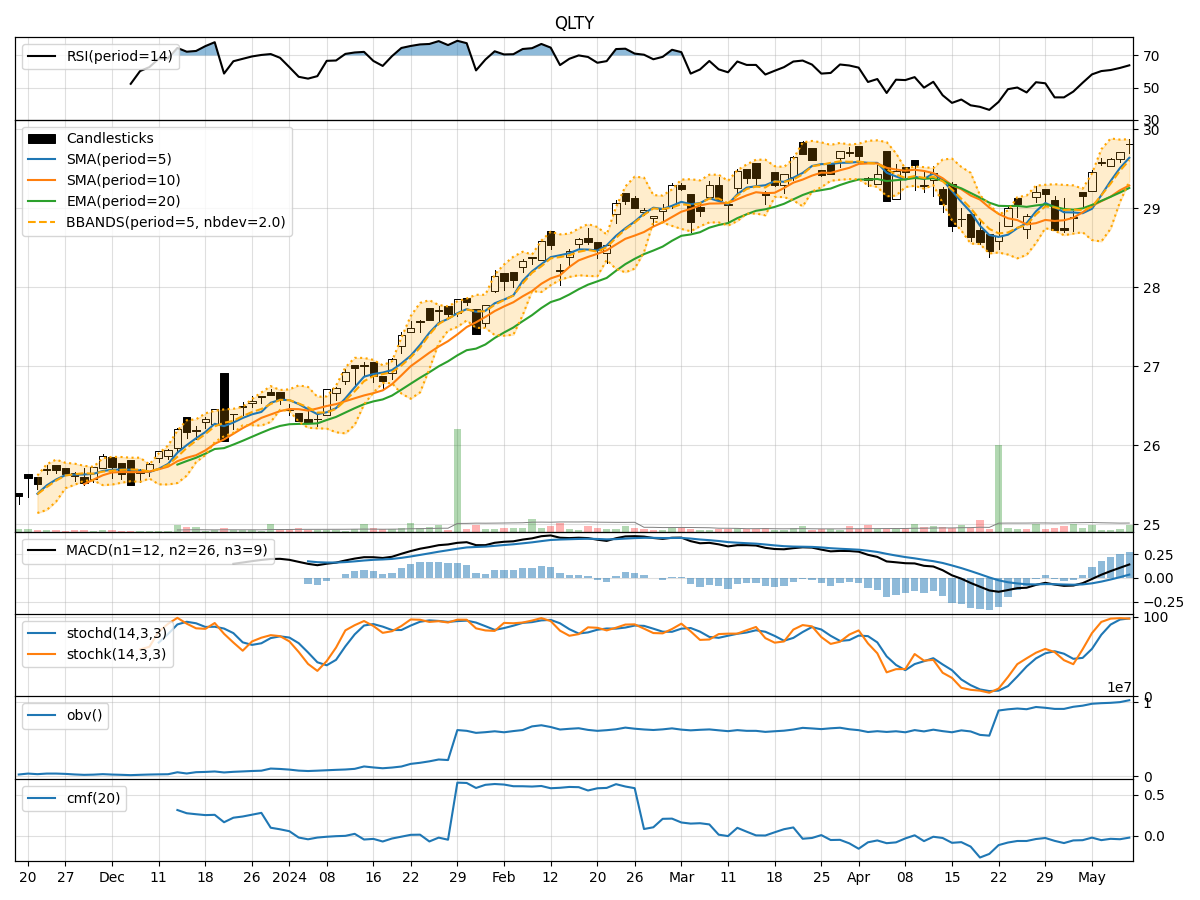
- Moving Averages (MA): The 5-day Moving Average (MA) has been consistently above the Simple Moving Average (SMA) and Exponential Moving Average (EMA), indicating a bullish trend.
- MACD: The MACD line has been consistently above the signal line, with both lines showing an upward trend, suggesting bullish momentum.
- RSI: The Relative Strength Index (RSI) has been increasing and is currently in the overbought territory, indicating a strong bullish momentum.
Momentum Analysis:
- Stochastic Oscillator: Both %K and %D lines of the Stochastic Oscillator are in the overbought zone, suggesting a potential reversal or consolidation.
- Williams %R: The Williams %R indicator is in the oversold territory, indicating a potential buying opportunity.
Volatility Analysis:
- Bollinger Bands (BB): The stock price has been trading within the Bollinger Bands, with the bands narrowing, suggesting a period of low volatility.
- BB% (Bollinger Band Percentage): The BB% is relatively low, indicating a potential breakout or significant price movement.
Volume Analysis:
- On-Balance Volume (OBV): The OBV has been increasing, indicating accumulation by investors.
- Chaikin Money Flow (CMF): The CMF is negative, suggesting some selling pressure in the stock.
Key Observations:
- The trend indicators suggest a strong bullish sentiment in the short term.
- Momentum indicators show a mix of overbought and oversold conditions, indicating a potential reversal or consolidation.
- Volatility indicators point towards a period of low volatility, potentially preceding a significant price movement.
- Volume indicators reflect a positive accumulation trend but with some selling pressure indicated by CMF.
Conclusion:
Based on the analysis of the technical indicators, the next few days' possible stock price movement for QLTY is likely to be upward in the short term. The bullish trend, supported by the MACD and RSI, indicates continued buying interest. However, caution is advised as the stochastic oscillator signals potential overbought conditions, suggesting a possible consolidation or minor pullback. Traders should monitor the volatility closely, as a breakout from the Bollinger Bands could lead to a significant price movement. Overall, the outlook for QLTY stock is bullish with a potential for a short-term price increase.