Technical Analysis of QLV 2024-05-10
Overview:
In analyzing the technical indicators for QLV stock over the last 5 days, we will delve into the trend, momentum, volatility, and volume indicators to provide a comprehensive outlook on the possible stock price movement in the coming days. By examining these key indicators, we aim to offer valuable insights and predictions for informed decision-making.
Trend Indicators:
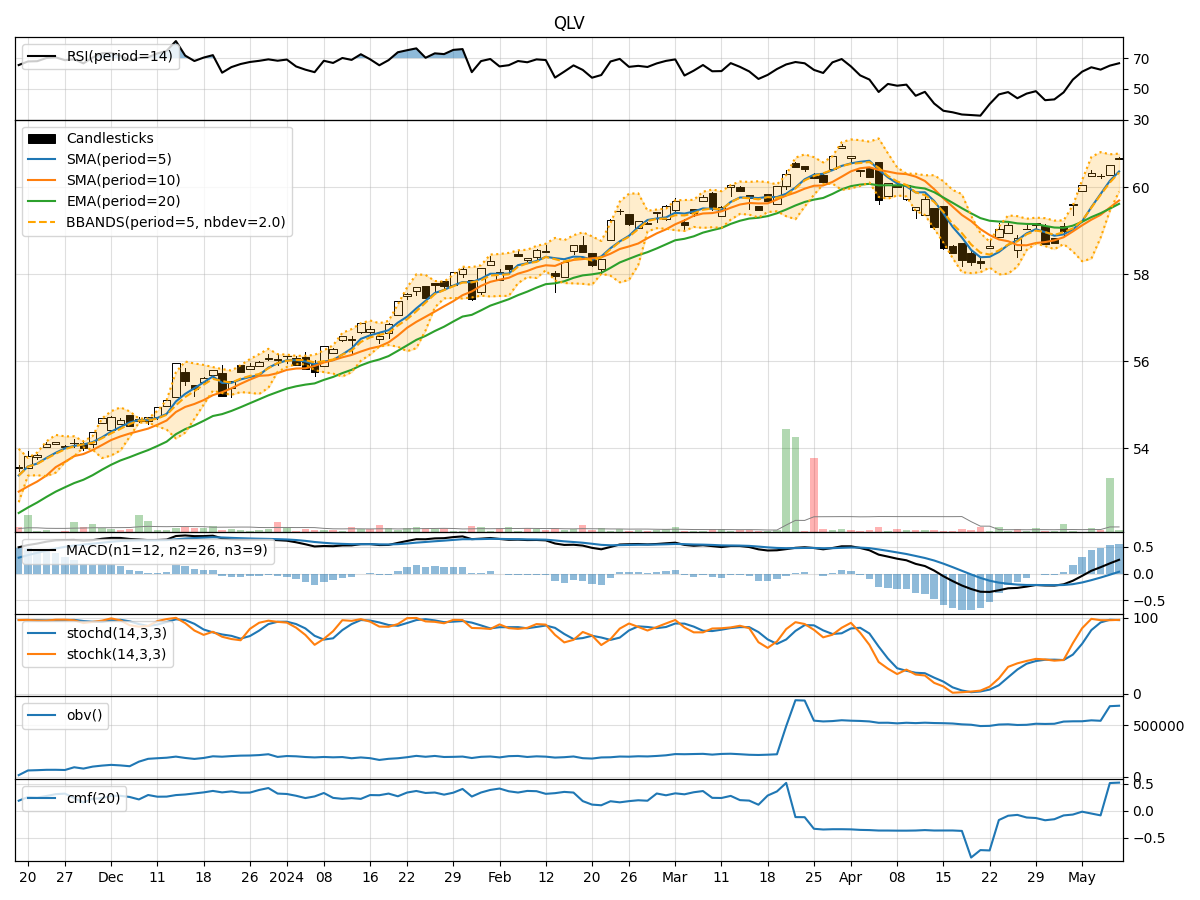
- Moving Averages (MA): The 5-day MA has been consistently above the closing prices, indicating a bullish trend.
- MACD: The MACD line has been trending upwards, with the MACD histogram showing positive values, suggesting bullish momentum.
- EMA: The EMA has been steadily increasing, supporting the bullish trend.
Momentum Indicators:
- RSI: The RSI has been in the overbought territory, indicating strong buying momentum.
- Stochastic Oscillator: Both %K and %D have been in the overbought zone, signaling a potential reversal.
- Williams %R: The indicator has been hovering near the oversold region, suggesting a possible buying opportunity.
Volatility Indicators:
- Bollinger Bands: The stock price has been trading within the bands, indicating moderate volatility.
- Bollinger %B: The %B value has been fluctuating around 0.8, suggesting a relatively high price compared to the upper band.
Volume Indicators:
- On-Balance Volume (OBV): The OBV has shown a positive trend, indicating accumulation by investors.
- Chaikin Money Flow (CMF): The CMF has been negative, suggesting some selling pressure in the stock.
Key Observations and Opinions:
- Trend: The stock is in a strong bullish trend based on moving averages and MACD.
- Momentum: While RSI indicates overbought conditions, stochastic and Williams %R suggest a potential reversal or consolidation.
- Volatility: The stock has exhibited moderate volatility within the Bollinger Bands.
- Volume: OBV reflects accumulation, but CMF signals some selling pressure.
Conclusion:
Based on the analysis of the technical indicators, the next few days' possible stock price movement for QLV is likely to be sideways to slightly bearish. The stock may experience a period of consolidation or a minor pullback after the recent bullish run. Traders should monitor key support and resistance levels for potential entry or exit points. It is advisable to exercise caution and wait for clearer signals before making significant trading decisions.