Technical Analysis of QLVD 2024-05-10
Overview:
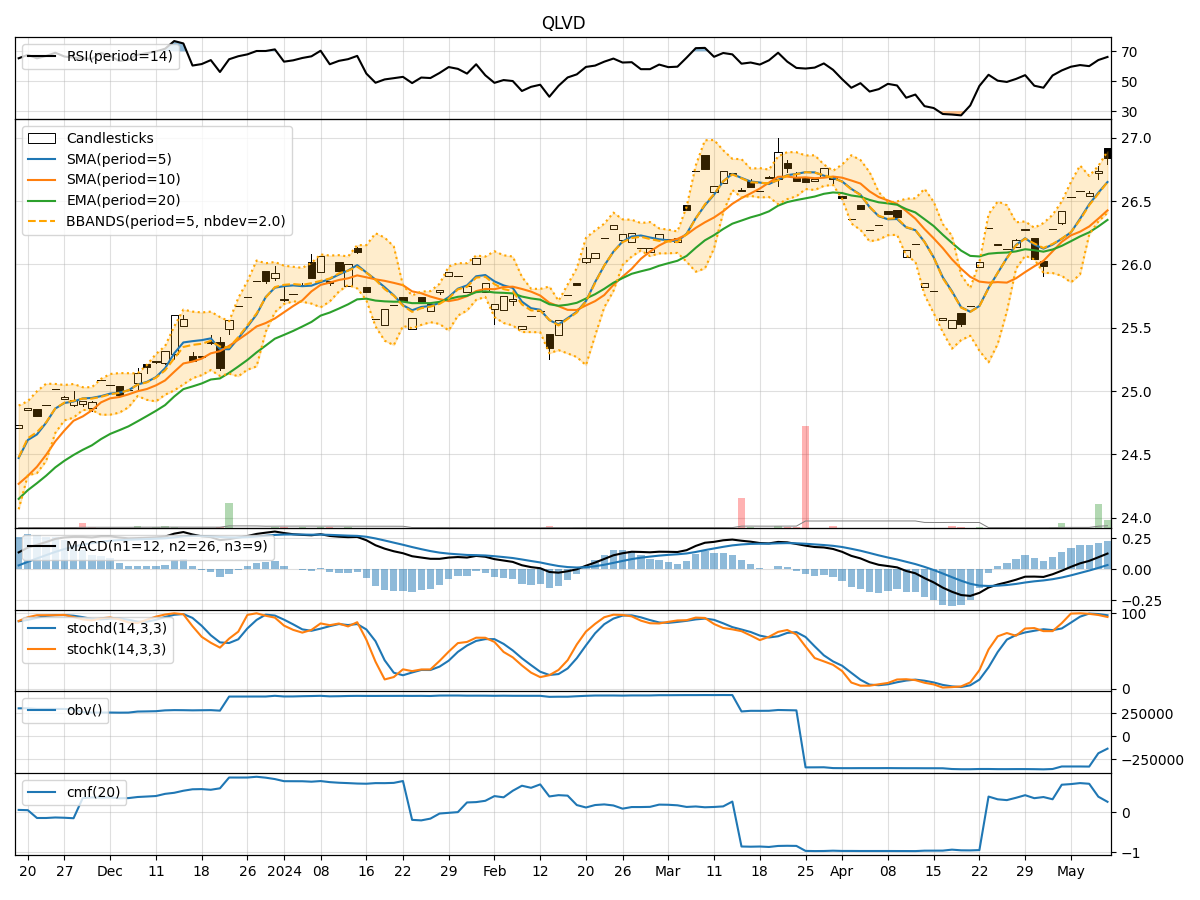
In the last 5 trading days, QLVD stock has shown a consistent uptrend in its price, with increasing volume and positive momentum indicators. The trend indicators suggest a bullish sentiment, supported by the momentum and volatility indicators. However, the volume indicators show a slight decrease in On-Balance Volume (OBV) and Chaikin Money Flow (CMF), indicating some divergence in volume activity. Let's delve deeper into each category of technical indicators to provide a comprehensive analysis and make a prediction for the next few days.
Trend Indicators:
- Moving Averages (MA): The 5-day Moving Average (MA) has been consistently above the Simple Moving Average (SMA) and Exponential Moving Average (EMA), indicating a bullish trend.
- MACD: The MACD line has been above the signal line for the past 5 days, with an increasing MACD Histogram, signaling a strengthening bullish momentum.
Momentum Indicators:
- RSI: The Relative Strength Index (RSI) has been in the overbought territory, indicating a strong buying momentum.
- Stochastic Oscillator: Both %K and %D lines have been above 80, suggesting an overbought condition.
- Williams %R: The Williams %R is also in the oversold region, indicating a potential reversal.
Volatility Indicators:
- Bollinger Bands (BB): The stock price has been trading within the upper Bollinger Band (BBU), suggesting an overbought condition.
- Bollinger %B: The Bollinger %B is above 0.8, indicating a potential reversal or pullback.
Volume Indicators:
- On-Balance Volume (OBV): The OBV has shown a slight decrease over the last 5 days, suggesting some divergence between price and volume.
- Chaikin Money Flow (CMF): The CMF has also decreased, indicating a potential weakening of buying pressure.
Key Observations and Opinions:
- Trend: The trend indicators suggest a strong bullish sentiment in the short term.
- Momentum: The momentum indicators indicate an overbought condition, which might lead to a potential reversal.
- Volatility: The volatility indicators point towards a possible pullback or consolidation phase.
- Volume: The slight decrease in volume indicators raises concerns about the sustainability of the current uptrend.
Conclusion:
Based on the analysis of the technical indicators, the stock price of QLVD is likely to experience a short-term pullback or consolidation in the next few days. Traders should exercise caution as the stock is currently in an overbought condition, and a reversal might be on the horizon. It is advisable to wait for confirmation signals before making any trading decisions.