Technical Analysis of QMID 2024-05-10
Overview:
In analyzing the technical indicators for the stock using the QMID TA data provided for the last 5 days, we will delve into the trend, momentum, volatility, and volume indicators to forecast the possible stock price movement in the upcoming days. By examining these key indicators, we aim to provide a comprehensive and insightful prediction for the stock's future direction.
Trend Analysis:
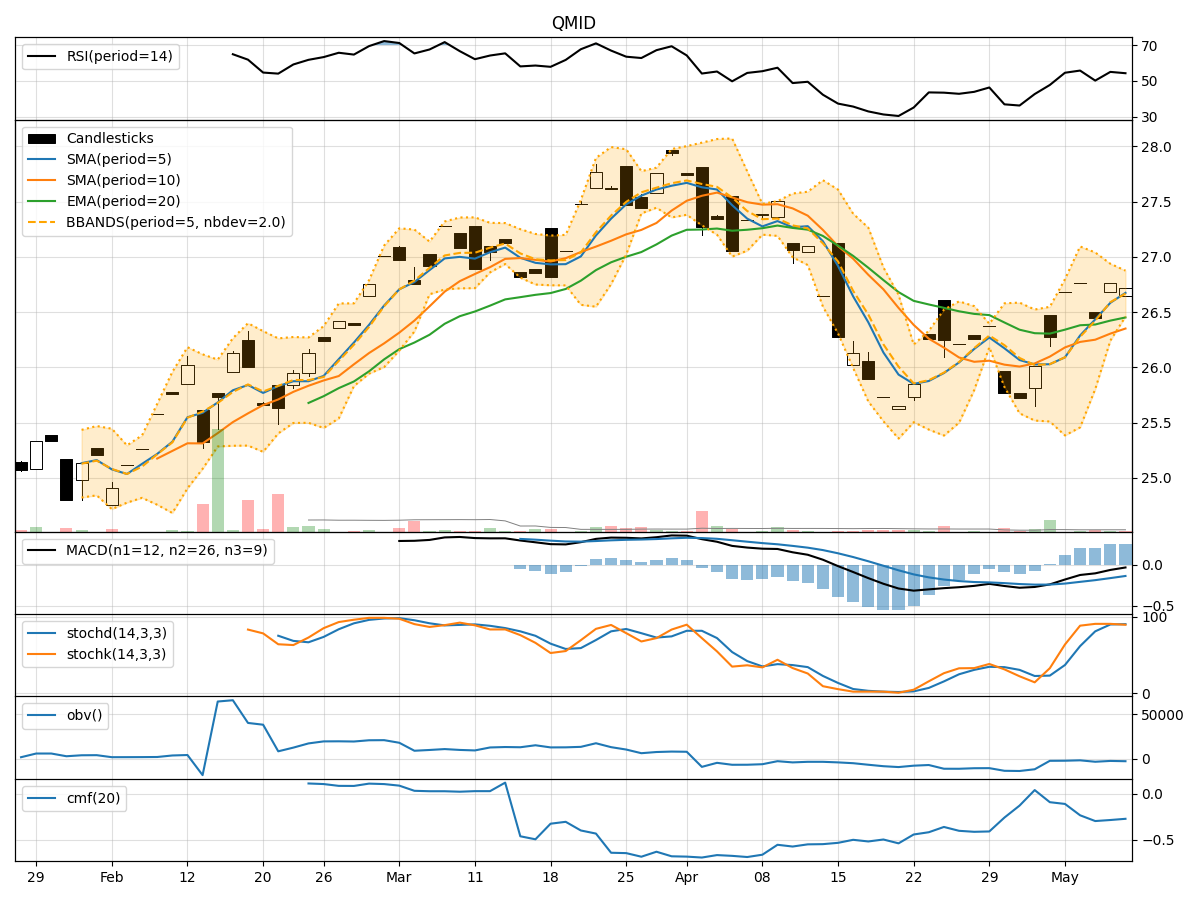
- Moving Averages (MA): The 5-day Moving Average (MA) has been consistently above the Simple Moving Average (SMA) and Exponential Moving Average (EMA) over the past 5 days, indicating a bullish trend.
- MACD: The Moving Average Convergence Divergence (MACD) has shown a positive trend with the MACD line consistently above the Signal line, suggesting upward momentum in the stock price.
Momentum Analysis:
- RSI: The Relative Strength Index (RSI) has been fluctuating around the 50 level, indicating a neutral momentum in the stock.
- Stochastic Oscillator: The Stochastic Oscillator has been in the overbought region, suggesting a potential reversal or consolidation in the stock price.
Volatility Analysis:
- Bollinger Bands (BB): The Bollinger Bands have been narrowing, indicating decreasing volatility in the stock price.
- Bollinger %B (BBP): The Bollinger %B has been hovering around 0.5, suggesting the stock is trading near the middle band.
Volume Analysis:
- On-Balance Volume (OBV): The OBV has shown a slight decrease over the past 5 days, indicating some selling pressure in the stock.
- Chaikin Money Flow (CMF): The CMF has been negative, reflecting a bearish money flow in the stock.
Conclusion:
Based on the analysis of the technical indicators, the stock is likely to experience sideways consolidation in the next few days. The bullish trend indicated by the moving averages and MACD may be offset by the neutral momentum reflected in the RSI and the overbought Stochastic Oscillator. The decreasing volatility and negative money flow suggest a lack of strong buying interest in the stock. Therefore, it is advisable to exercise caution and closely monitor the price action for any potential breakout or reversal signals before making any trading decisions.