Technical Analysis of QMOM 2024-05-10
Overview:
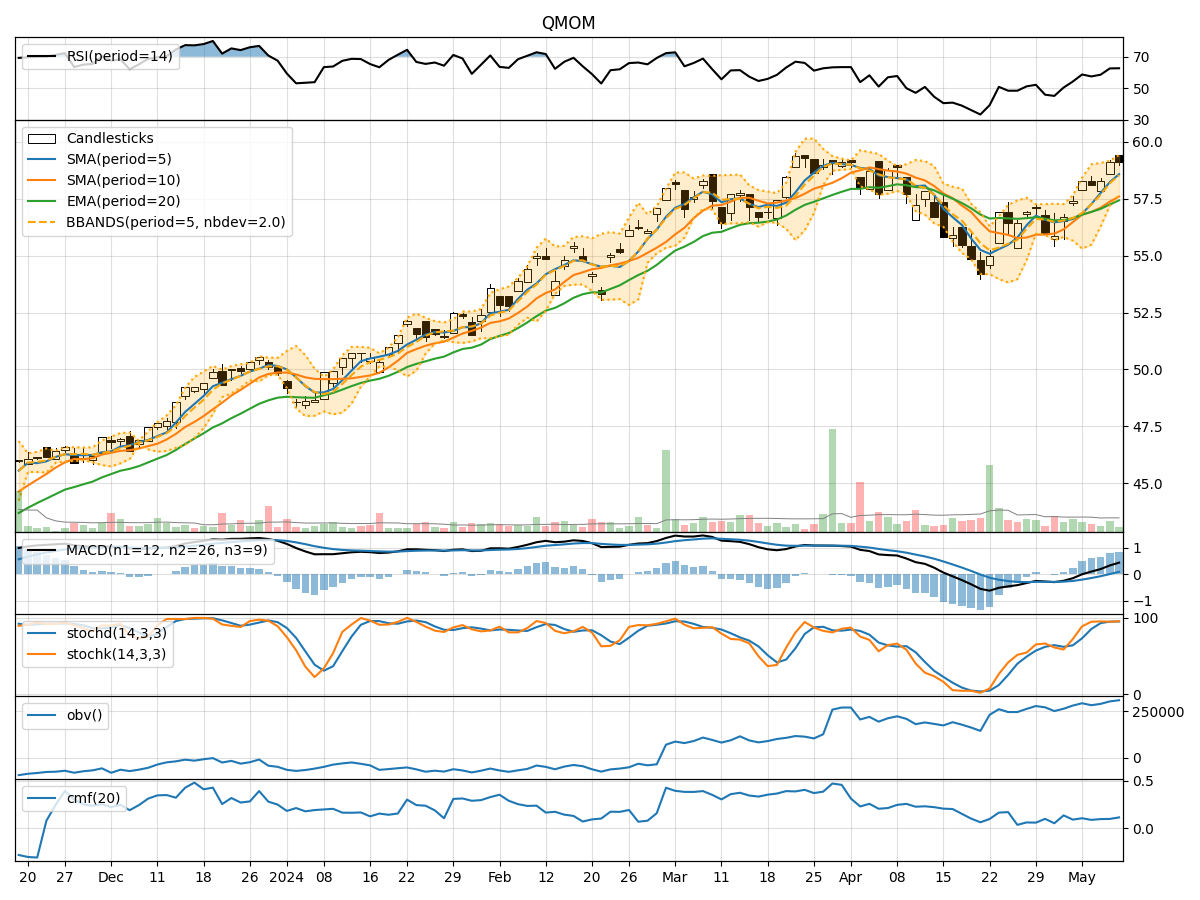
In the last 5 trading days, the stock price of QMOM has shown a generally positive trend with increasing closing prices. Various technical indicators across trend, momentum, volatility, and volume categories have been analyzed to provide insights into the possible future stock price movement.
Trend Analysis:
- Moving Averages (MA): The 5-day Moving Average (MA) has been consistently above the Simple Moving Average (SMA) and Exponential Moving Average (EMA), indicating a bullish trend.
- MACD: The MACD line has been consistently above the signal line, with both lines showing an upward trend, suggesting further price appreciation.
- Momentum: The Relative Strength Index (RSI) has been in the overbought region, indicating a strong bullish momentum.
Momentum Analysis:
- RSI: The RSI has been consistently high, indicating strong buying momentum in the stock.
- Stochastic Oscillator: Both %K and %D lines of the Stochastic Oscillator have been in the overbought region, suggesting a potential reversal or consolidation.
Volatility Analysis:
- Bollinger Bands (BB): The stock price has been trading above the middle Bollinger Band (BBM), indicating an uptrend. The bands are relatively narrow, suggesting low volatility.
- Bollinger Band Percentage (BBP): The BBP has been fluctuating around 0.8, indicating that the stock is trading closer to the upper band.
Volume Analysis:
- On-Balance Volume (OBV): The OBV has been steadily increasing, indicating strong buying volume in the stock.
- Chaikin Money Flow (CMF): The CMF has been positive, indicating that money is flowing into the stock.
Key Observations:
- The stock is in a strong uptrend based on moving averages and MACD.
- Momentum indicators like RSI and Stochastic Oscillator suggest overbought conditions, signaling a potential reversal or consolidation.
- Volatility is relatively low, as indicated by narrow Bollinger Bands and high BBP.
- Strong buying volume, as seen in OBV and CMF, supports the bullish trend.
Conclusion:
Based on the analysis of technical indicators, the next few days' possible stock price movement for QMOM is likely to continue upwards in the short term. However, given the overbought signals from momentum indicators, there might be a temporary consolidation or pullback before the uptrend resumes. Traders should closely monitor the price action and key support levels for potential entry or exit points.