Technical Analysis of QPFF 2024-05-10
Overview:
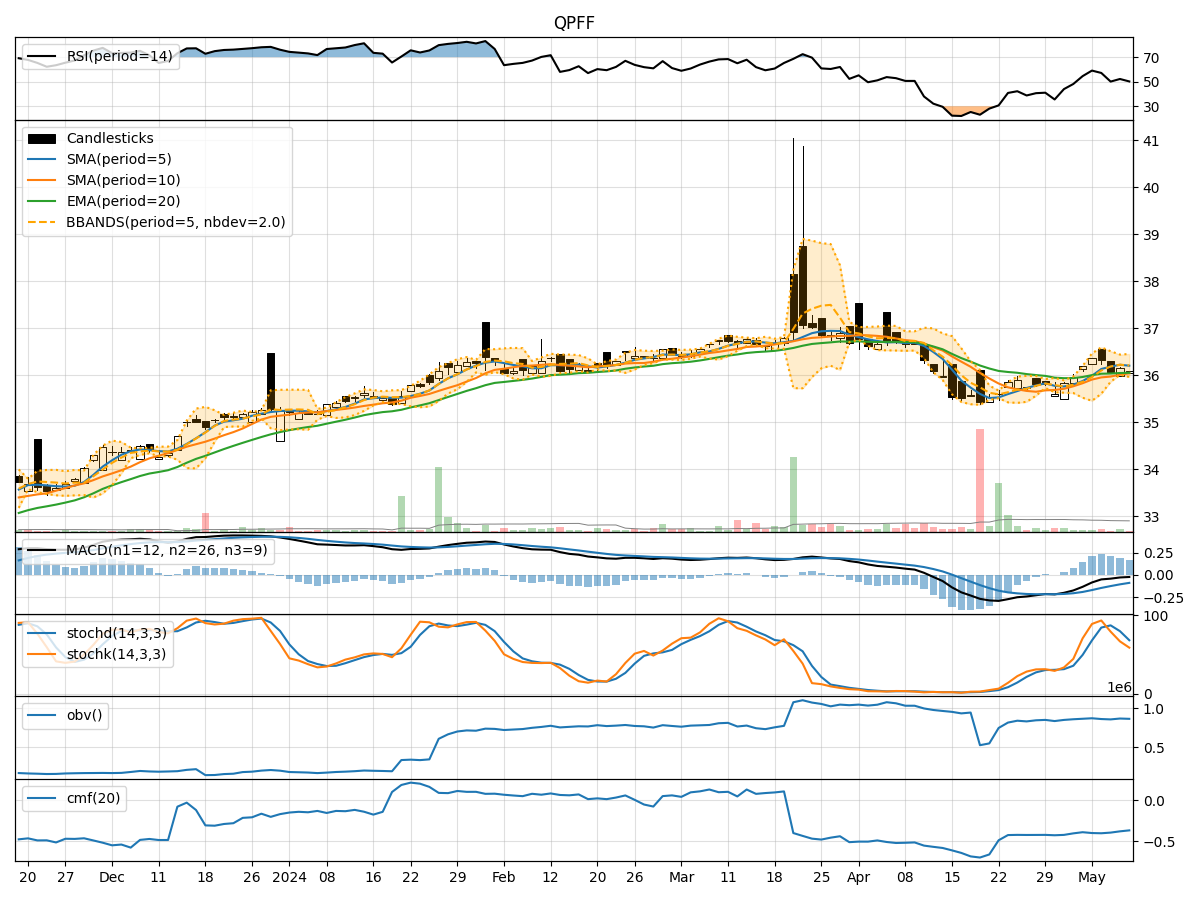
In analyzing the technical indicators for QPFF over the last 5 days, we will delve into the trends, momentum, volatility, and volume aspects to provide a comprehensive outlook on the possible stock price movement. By examining key indicators such as moving averages, MACD, RSI, Bollinger Bands, and OBV, we aim to offer valuable insights and predictions for the upcoming days.
Trend Analysis:
- Moving Averages (MA): The 5-day MA has been relatively stable around the closing prices, indicating a consistent trend.
- MACD: The MACD line has been consistently below the signal line, suggesting a bearish trend.
- EMA: The EMA has been slightly above the closing prices, indicating a potential bullish momentum.
Momentum Analysis:
- RSI: The RSI values have been fluctuating around the mid-range, indicating indecision in the market.
- Stochastic Oscillator: Both %K and %D values have been declining, signaling a potential bearish momentum.
- Williams %R: The Williams %R values have been consistently in the oversold territory, suggesting a bearish sentiment.
Volatility Analysis:
- Bollinger Bands: The stock price has been trading within the bands, indicating a period of consolidation.
- Bollinger %B: The %B values have been fluctuating around the mid-range, suggesting a lack of clear direction in price movement.
Volume Analysis:
- On-Balance Volume (OBV): The OBV values have been declining, indicating selling pressure in the market.
- Chaikin Money Flow (CMF): The CMF values have been consistently negative, suggesting a lack of buying interest.
Key Observations:
- The trend indicators show a mixed signal with a slight bullish bias from the EMA.
- Momentum indicators point towards a bearish sentiment with oversold conditions.
- Volatility indicators suggest a period of consolidation with no clear trend.
- Volume indicators indicate selling pressure and a lack of buying interest in the market.
Conclusion:
Based on the analysis of the technical indicators, the stock price of QPFF is likely to experience further downward movement in the next few days. The bearish momentum indicated by the MACD, Stochastic Oscillator, and Williams %R, coupled with the negative OBV and CMF values, suggests a lack of buying interest and potential selling pressure. Traders and investors should exercise caution and consider short-term bearish strategies or wait for a clearer signal before entering any long positions.