Technical Analysis of QQEW 2024-05-10
Overview:
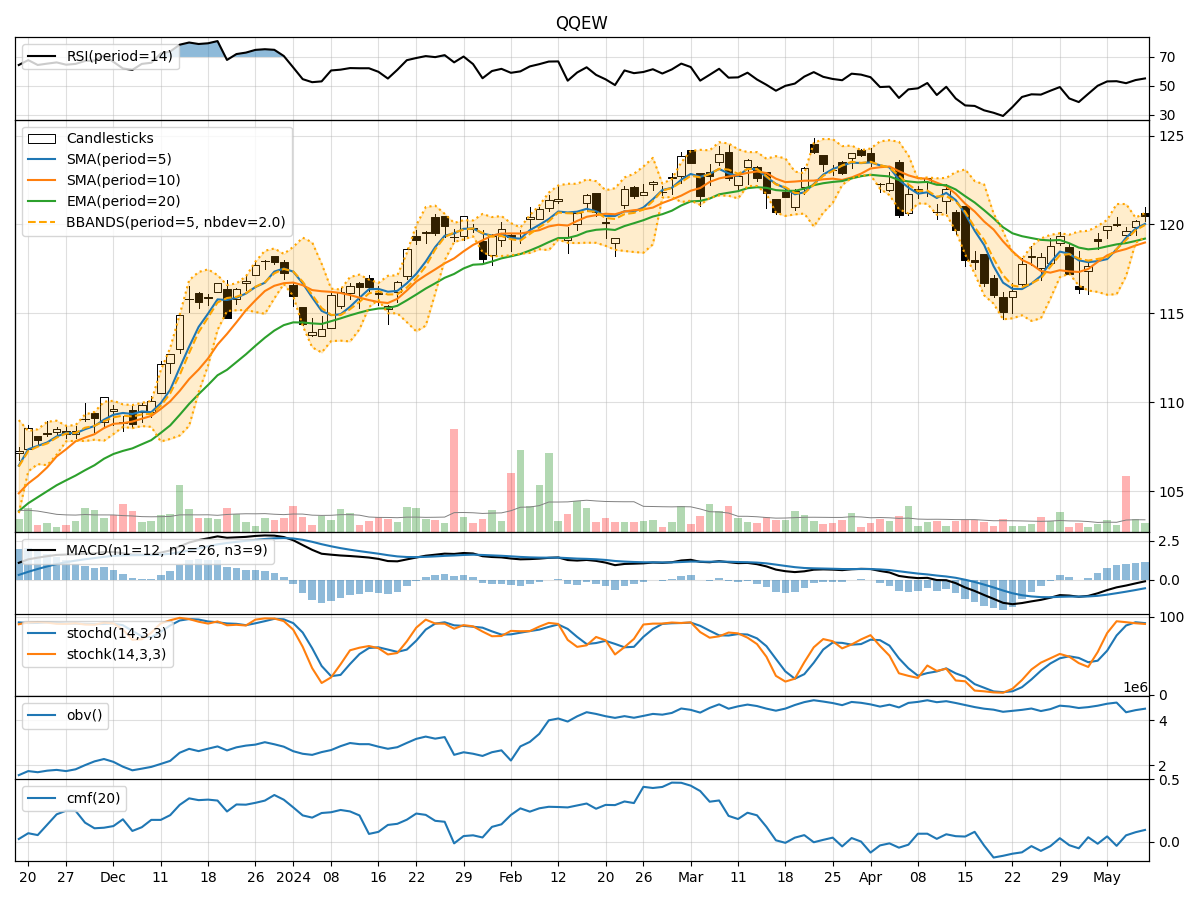
In the last 5 trading days, the QQEW stock has shown a consistent uptrend in its price, with increasing volumes. The moving averages have been trending upwards, indicating a bullish sentiment. Momentum indicators like RSI and Stochastic oscillators suggest the stock is in overbought territory. Volatility indicators show narrowing Bollinger Bands, indicating a potential decrease in volatility. Volume indicators like OBV and CMF show positive accumulation.
Trend Analysis:
- Moving Averages (MA): The 5-day MA has been consistently above the 10-day SMA, indicating a short-term bullish trend. The EMA(20) is also trending upwards, supporting the bullish sentiment.
- MACD: The MACD line has been above the signal line for the past 5 days, indicating a bullish momentum.
Momentum Analysis:
- RSI: The RSI is in the overbought zone, suggesting a potential reversal or consolidation in the near future.
- Stochastic Oscillators: Both %K and %D are in the overbought region, indicating a possible pullback.
Volatility Analysis:
- Bollinger Bands (BB): The narrowing of the Bollinger Bands suggests decreasing volatility and a potential period of consolidation.
Volume Analysis:
- On-Balance Volume (OBV): The OBV has been steadily increasing, indicating strong buying pressure.
- Chaikin Money Flow (CMF): The CMF is positive, suggesting that money is flowing into the stock.
Key Observations:
- The stock is currently in a strong uptrend, supported by moving averages and MACD.
- Momentum indicators signal overbought conditions, hinting at a possible correction or consolidation.
- Volatility is decreasing, indicating a potential period of stability.
- Volume indicators show positive accumulation, supporting the bullish trend.
Conclusion:
Based on the technical analysis of the trend, momentum, volatility, and volume indicators, the next few days for QQEW stock are likely to see a consolidation or a minor pullback. The stock has been in overbought territory, and the narrowing Bollinger Bands suggest a decrease in volatility. Traders may consider taking profits or waiting for a better entry point before considering long positions. Exercise caution and monitor the price action closely for potential reversal signals.