Technical Analysis of QQJG 2024-05-10
Overview:
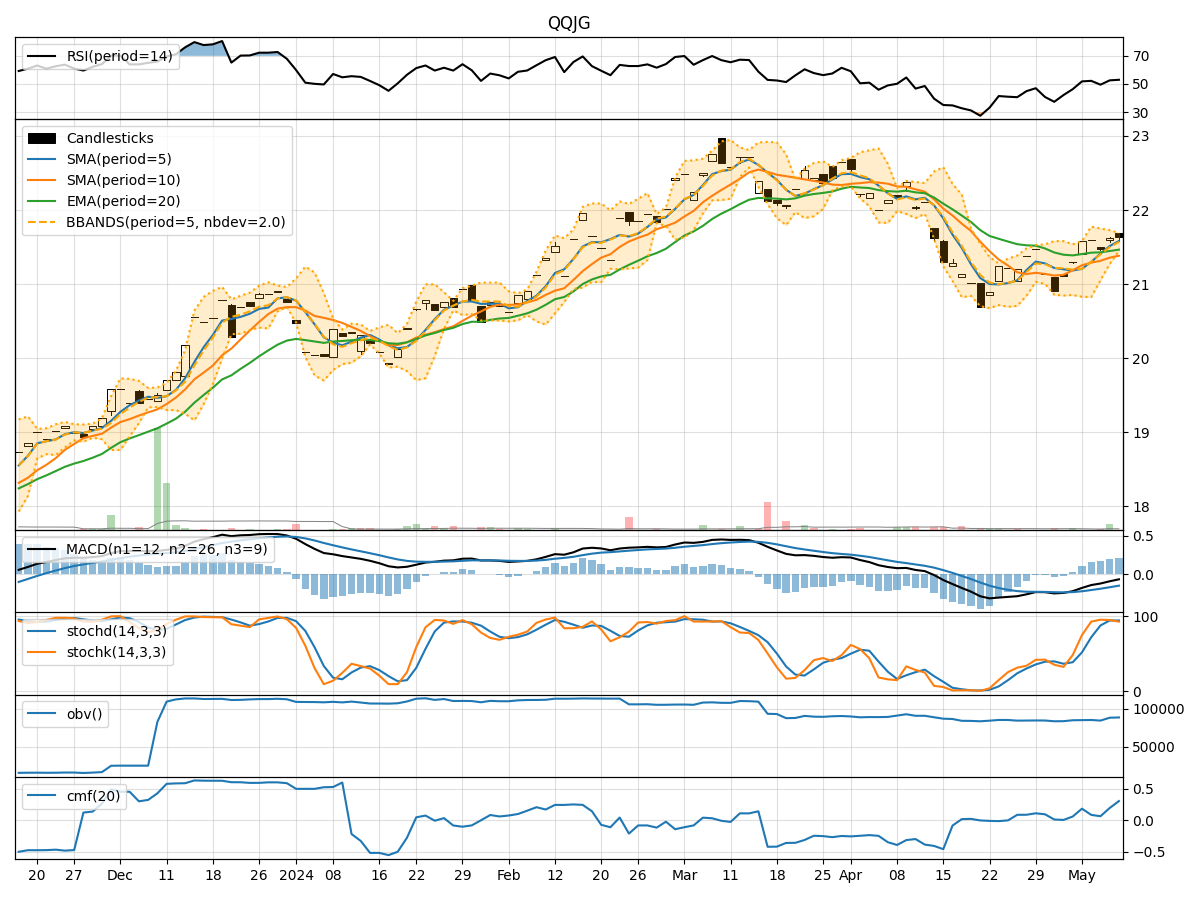
In analyzing the technical indicators for QQJG stock over the last 5 days, we will delve into the trend, momentum, volatility, and volume indicators to provide a comprehensive outlook on the possible future stock price movement. By examining these key indicators, we aim to offer valuable insights and recommendations for potential investors.
Trend Indicators:
- Moving Averages (MA): The 5-day Moving Average (MA) has been consistently above the Simple Moving Average (SMA) and Exponential Moving Average (EMA), indicating a short-term bullish trend.
- MACD: The Moving Average Convergence Divergence (MACD) has shown a positive trend with the MACD line consistently above the Signal line, suggesting bullish momentum.
- MACD Histogram: The MACD Histogram has been increasing over the past 5 days, indicating strengthening bullish momentum.
Momentum Indicators:
- RSI: The Relative Strength Index (RSI) has been hovering around the neutral zone, indicating a balanced momentum without extreme overbought or oversold conditions.
- Stochastic Oscillator: Both %K and %D lines of the Stochastic Oscillator have been in the overbought territory, suggesting a potential reversal or consolidation.
- Williams %R: The Williams %R indicator has shown oversold conditions on some days, indicating potential buying opportunities.
Volatility Indicators:
- Bollinger Bands: The Bollinger Bands have been narrowing, suggesting decreasing volatility and a possible period of consolidation.
- Bollinger %B: The %B indicator has been fluctuating within a narrow range, indicating a lack of clear direction in price movement.
Volume Indicators:
- On-Balance Volume (OBV): The OBV indicator has shown mixed signals with fluctuations in volume, indicating indecision among market participants.
- Chaikin Money Flow (CMF): The CMF has been positive, suggesting that money flow into the stock has been relatively strong over the past 20 days.
Conclusion:
Based on the analysis of the technical indicators, the stock price of QQJG is likely to experience sideways movement in the near future. The trend indicators suggest a bullish bias, supported by the MACD and moving averages. However, the momentum indicators show signs of potential reversal or consolidation, especially with the Stochastic Oscillator in the overbought zone. Volatility indicators point towards a period of consolidation, while volume indicators indicate mixed participation from investors.
Recommendation:
Considering the overall technical picture, it is advisable to exercise caution and closely monitor the price action of QQJG in the coming days. Traders may consider implementing range-bound strategies to capitalize on potential sideways movement, while investors might opt to wait for clearer signals before making significant decisions. It is essential to remain vigilant and adapt to changing market conditions to make informed trading choices.