Technical Analysis of QQMG 2024-05-10
Overview:
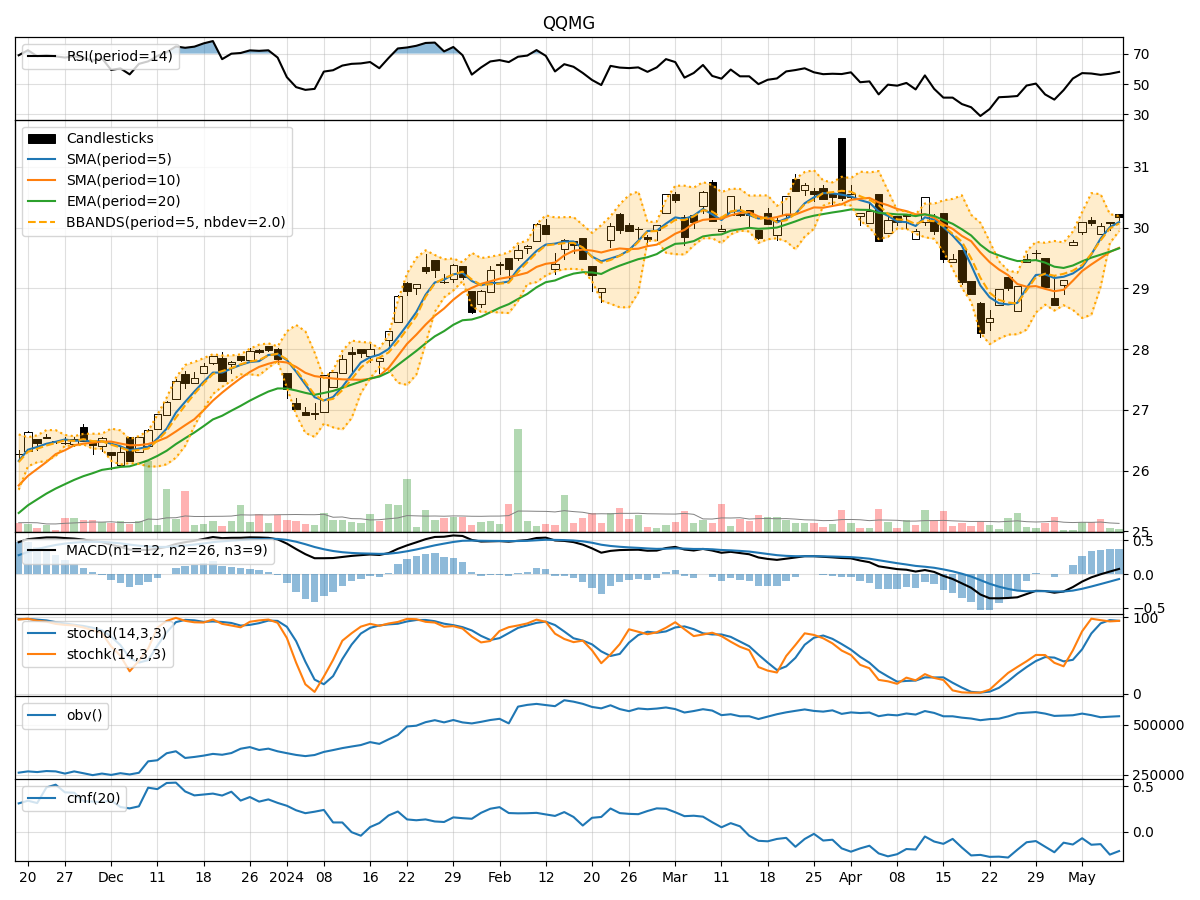
In analyzing the technical indicators for QQMG stock over the last 5 days, we will delve into the trend, momentum, volatility, and volume indicators to provide a comprehensive outlook on the possible stock price movement in the coming days.
Trend Analysis:
- Moving Averages (MA): The 5-day MA has been consistently above the closing prices, indicating a bullish trend.
- MACD: The MACD line has been consistently above the signal line, suggesting a bullish momentum.
- RSI: The RSI values have been fluctuating but generally staying above 50, indicating bullish momentum.
Momentum Analysis:
- Stochastic Oscillator: Both %K and %D values have been above 80, indicating overbought conditions.
- Williams %R: The values have been negative, indicating potential oversold conditions.
Volatility Analysis:
- Bollinger Bands: The bands have been narrowing, indicating decreasing volatility.
- Bollinger %B: The %B values have been fluctuating within a narrow range, suggesting stable volatility.
Volume Analysis:
- On-Balance Volume (OBV): The OBV has been declining, indicating selling pressure.
- Chaikin Money Flow (CMF): The CMF has been negative, indicating a lack of buying pressure.
Key Observations:
- The trend indicators suggest a bullish sentiment in the short term.
- Momentum indicators show overbought conditions, which might lead to a potential pullback.
- Volatility indicators point towards decreasing volatility and a possible period of consolidation.
- Volume indicators indicate selling pressure and a lack of significant buying interest.
Conclusion:
Based on the analysis of the technical indicators, the next few days for QQMG stock are likely to see a short-term bullish trend with potential for a pullback due to overbought conditions. The decreasing volatility and lack of significant buying pressure suggest a period of consolidation may be on the horizon. However, the selling pressure indicated by volume indicators warrants caution, as it could lead to a downward correction in the near future.
Recommendation:
- Short-term traders: Consider taking profits or setting tight stop-loss orders to manage potential downside risk.
- Long-term investors: Monitor the stock closely for a potential entry point during a pullback to benefit from the overall bullish trend.
Disclaimer:
Remember that market dynamics can change rapidly, and it's essential to stay updated on the latest developments and conduct further analysis before making any investment decisions. Consulting with a financial advisor is recommended to align your investment strategy with your financial goals and risk tolerance.