Technical Analysis of QQQA 2024-05-10
Overview:
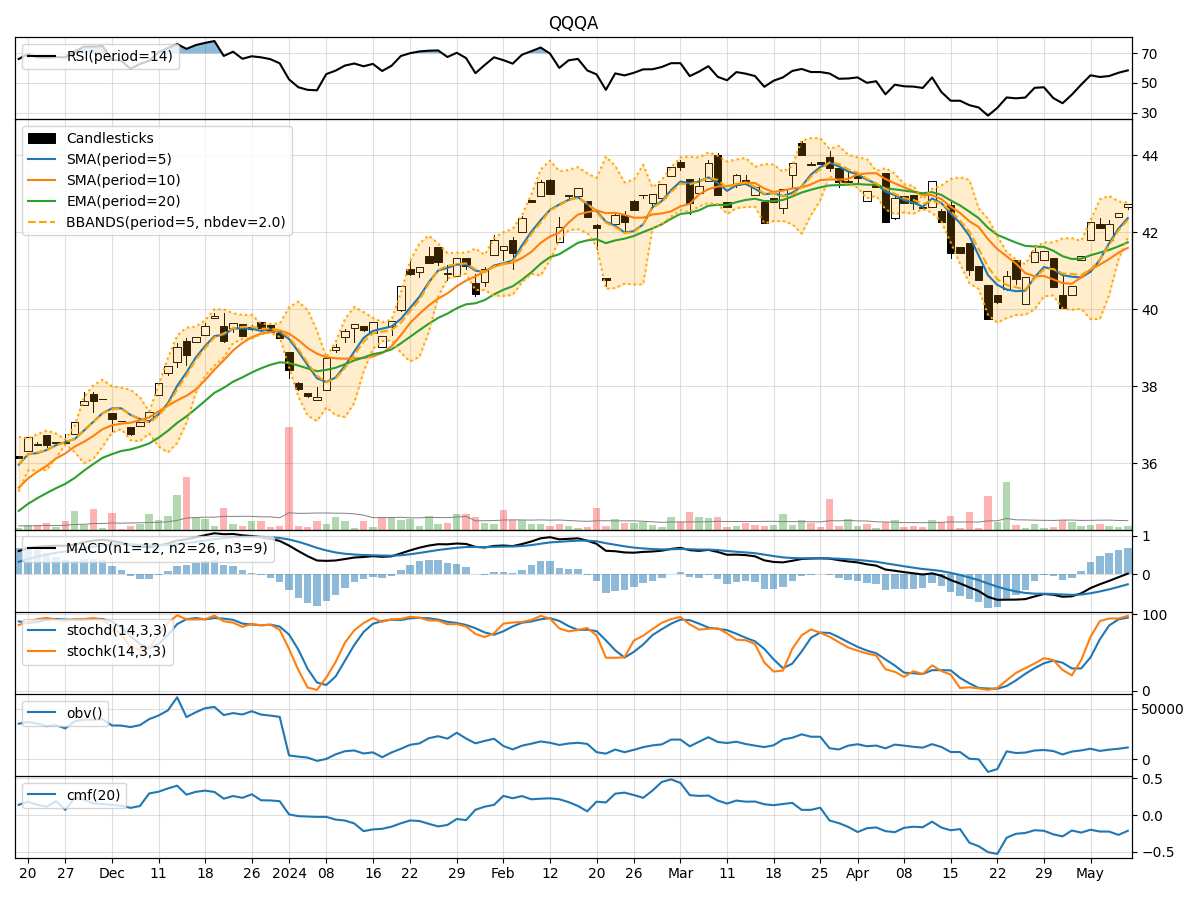
In analyzing the technical indicators for QQQA over the last 5 days, we will delve into the trend, momentum, volatility, and volume indicators to provide a comprehensive outlook on the possible stock price movement in the coming days. By examining these key indicators, we aim to offer valuable insights and predictions to guide your investment decisions.
Trend Analysis:
- Moving Averages (MA): The 5-day moving average has been consistently above the simple moving average (SMA) and exponential moving average (EMA), indicating a bullish trend.
- MACD: The MACD line has been above the signal line, with both lines showing an upward trend, suggesting bullish momentum.
- Conclusion: The trend indicators point towards an upward movement in the stock price.
Momentum Analysis:
- RSI: The Relative Strength Index (RSI) has been increasing, indicating strengthening momentum.
- Stochastic Oscillator: Both %K and %D have been in the overbought zone, suggesting a strong bullish momentum.
- Conclusion: Momentum indicators signal a bullish sentiment in the stock.
Volatility Analysis:
- Bollinger Bands (BB): The stock price has been trading within the upper Bollinger Band, indicating high volatility.
- Conclusion: Volatility indicators suggest a highly volatile market environment.
Volume Analysis:
- On-Balance Volume (OBV): The OBV has been fluctuating but generally showing a slight decrease, indicating some selling pressure.
- Chaikin Money Flow (CMF): The CMF has been negative, suggesting a bearish sentiment.
- Conclusion: Volume indicators reflect a slight bearish sentiment in the stock.
Key Observations:
- The trend and momentum indicators align in signaling an upward movement in the stock price.
- Volatility remains high, indicating potential price swings.
- Volume indicators show a slight bearish sentiment, possibly due to profit-taking.
Conclusion:
Based on the analysis of the technical indicators, the next few days are likely to see the stock price of QQQA continue its upward trajectory, supported by strong trend and momentum signals. However, the high volatility suggests the possibility of sharp price movements. The slight bearish sentiment in volume indicators may lead to short-term fluctuations but is not strong enough to reverse the overall bullish outlook. Therefore, the overall forecast for the next few days is bullish with potential short-term fluctuations due to market volatility.