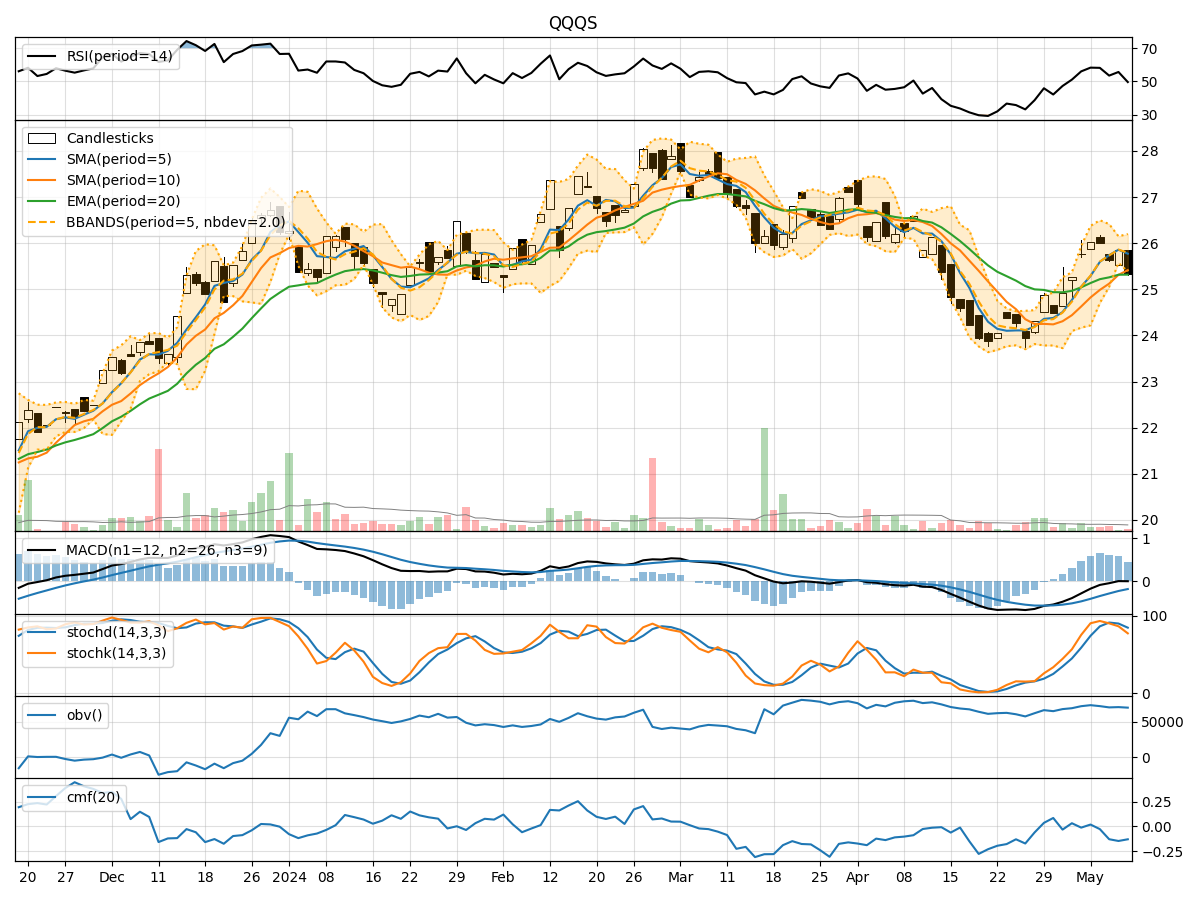
Technical Analysis of QQQS 2024-05-10
Overview:
In analyzing the technical indicators for QQQS over the last 5 days, we will delve into the trend, momentum, volatility, and volume indicators to provide a comprehensive outlook on the possible stock price movement in the coming days. By examining these key aspects, we aim to offer valuable insights and predictions for informed decision-making.
Trend Analysis:
- Moving Averages (MA): The 5-day Moving Average (MA) has been consistently above the Simple Moving Average (SMA) and Exponential Moving Average (EMA), indicating a bullish trend.
- MACD: The MACD line has been consistently below the signal line, suggesting a bearish trend.
- Momentum: The MACD Histogram has been decreasing, indicating a weakening bullish momentum.
Momentum Analysis:
- RSI: The Relative Strength Index (RSI) has been fluctuating around the neutral level of 50, indicating indecision in the market.
- Stochastic Oscillator: Both %K and %D have been declining, signaling a potential bearish momentum.
- Williams %R: The Williams %R is in oversold territory, suggesting a possible reversal in the short term.
Volatility Analysis:
- Bollinger Bands (BB): The price has been trading within the Bollinger Bands, with the bands narrowing, indicating decreasing volatility.
- Bollinger %B: The %B indicator is close to 0, suggesting a potential oversold condition.
Volume Analysis:
- On-Balance Volume (OBV): The OBV has been declining, indicating selling pressure in the market.
- Chaikin Money Flow (CMF): The CMF has been negative, reflecting a bearish sentiment among investors.
Conclusion:
Based on the analysis of the technical indicators, the stock price of QQQS is likely to experience further downward movement in the coming days. The bearish trend indicated by the MACD, declining momentum in the Stochastic Oscillator, and negative OBV and CMF suggest a bearish outlook. Traders should exercise caution and consider shorting positions or staying on the sidelines until a clear reversal pattern emerges.
Key Takeaways:
- Trend: Bearish
- Momentum: Bearish
- Volatility: Decreasing
- Volume: Bearish
Recommendation:
Given the overall bearish sentiment in the technical indicators, it is advisable to avoid long positions and consider short-term bearish strategies. Monitoring key support levels and waiting for a potential reversal confirmation would be prudent before considering any long positions.