Technical Analysis of QQQY 2024-05-10
Overview:
In analyzing the technical indicators for QQQY over the last 5 days, we will delve into the trend, momentum, volatility, and volume indicators to provide a comprehensive outlook on the possible stock price movement in the coming days. By examining these key indicators, we aim to offer valuable insights and predictions for potential investors.
Trend Analysis:
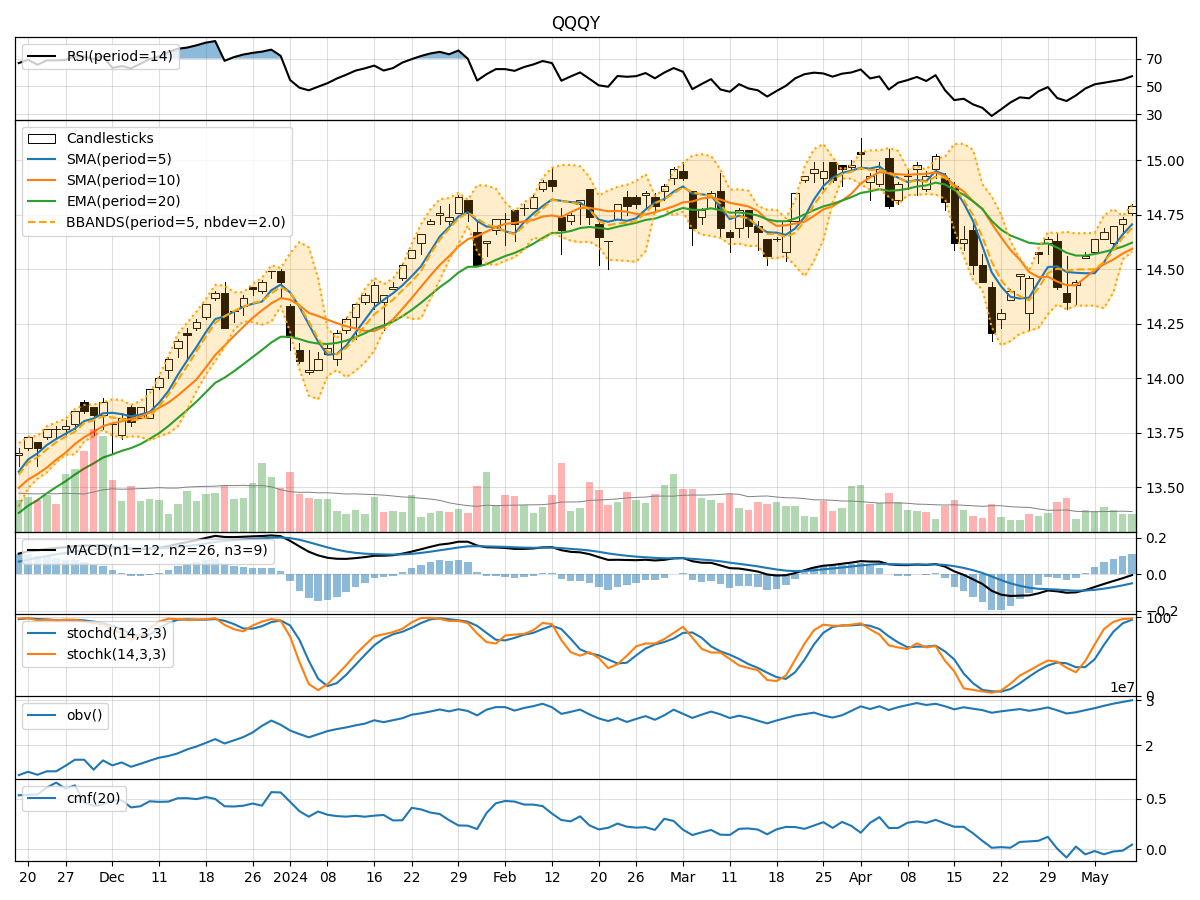
- Moving Averages (MA): The 5-day Moving Average (MA) has been consistently above the Simple Moving Average (SMA) and Exponential Moving Average (EMA), indicating a short-term bullish trend.
- MACD: The MACD line has been negative but showing signs of convergence towards the signal line, suggesting a potential reversal in the trend.
- MACD Histogram: The MACD Histogram has been gradually decreasing, indicating a weakening bearish momentum.
Momentum Analysis:
- RSI: The Relative Strength Index (RSI) has been steadily increasing, reflecting growing buying pressure and potential overbought conditions.
- Stochastic Oscillator: Both %K and %D lines of the Stochastic Oscillator are in the overbought zone, signaling a possible reversal or consolidation.
- Williams %R: The Williams %R is in the oversold territory, indicating a potential buying opportunity.
Volatility Analysis:
- Bollinger Bands (BB): The price has been trading within the Bollinger Bands, with the bands narrowing, suggesting a period of low volatility.
- Bollinger %B: The %B indicator is above 0.8, indicating a potential overbought condition.
- Average True Range (ATR): The ATR has been decreasing, signaling a decline in volatility.
Volume Analysis:
- On-Balance Volume (OBV): The OBV has been fluctuating but overall showing a slight increase, suggesting accumulation by investors.
- Chaikin Money Flow (CMF): The CMF has been negative, indicating selling pressure in the market.
Key Observations and Opinions:
- Trend: The trend indicators suggest a potential reversal in the short-term bullish trend.
- Momentum: Mixed signals are observed with overbought conditions in RSI and Stochastic Oscillator, but oversold condition in Williams %R.
- Volatility: Low volatility is indicated by the narrowing Bollinger Bands and decreasing ATR.
- Volume: The volume indicators show a slight increase in accumulation but negative CMF indicates selling pressure.
Conclusion:
Based on the analysis of the technical indicators, the next few days' possible stock price movement for QQQY could be sideways consolidation with a slight downward bias. Investors should closely monitor the trend reversal signals, overbought conditions in momentum indicators, and the impact of low volatility on price movements. It is advisable to exercise caution and wait for clearer signals before making significant trading decisions.