Technical Analysis of QRFT 2024-05-10
Overview:
In analyzing the technical indicators for QRFT stock over the last 5 days, we will delve into the trend, momentum, volatility, and volume indicators to provide a comprehensive outlook on the possible stock price movement in the coming days. By examining these key aspects, we aim to offer valuable insights and predictions to guide your investment decisions.
Trend Analysis:
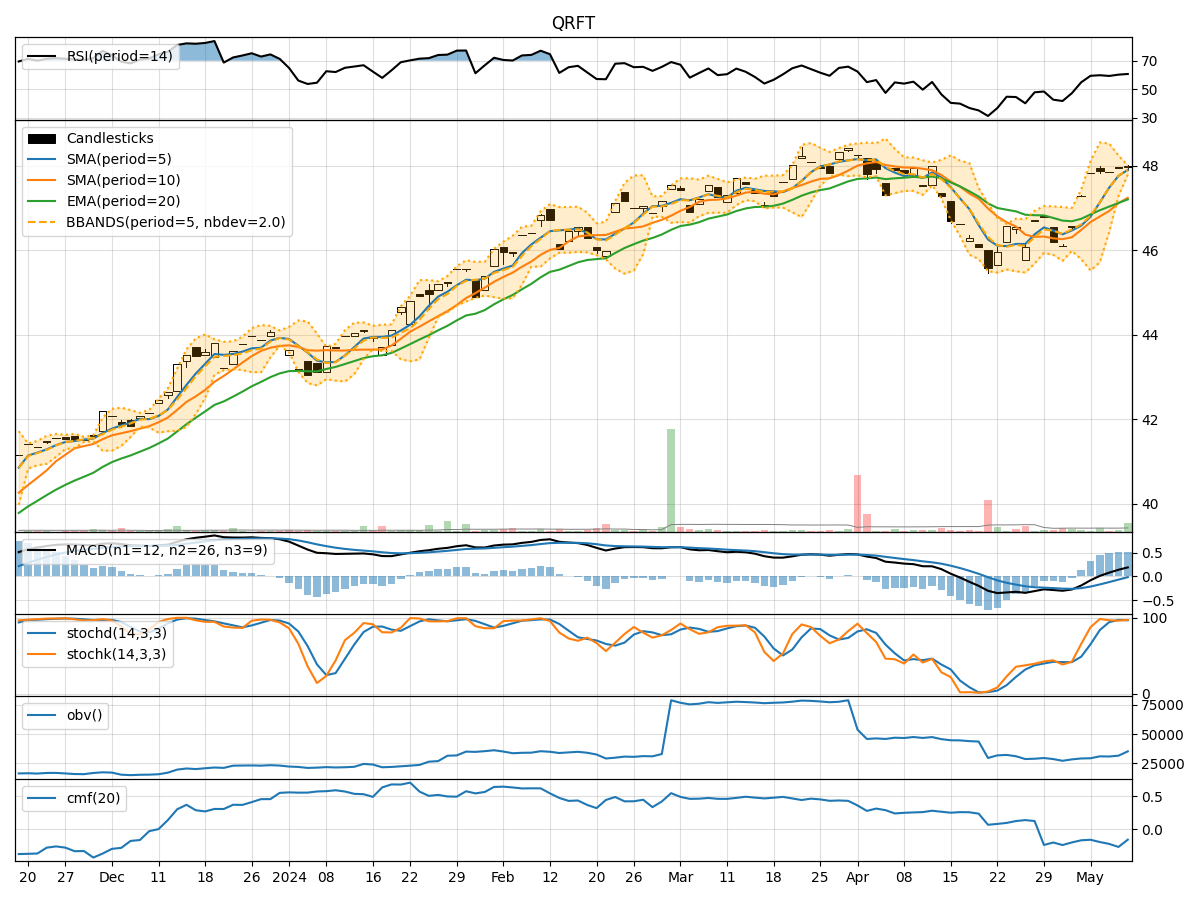
- Moving Averages (MA): The 5-day Moving Average (MA) has been consistently above the Simple Moving Average (SMA) and Exponential Moving Average (EMA), indicating a bullish trend.
- MACD: The MACD line has been consistently above the signal line, with both lines trending upwards, suggesting a bullish momentum.
- MACD Histogram: The MACD Histogram has been increasing over the past 5 days, indicating strengthening bullish momentum.
Momentum Analysis:
- RSI: The Relative Strength Index (RSI) has been gradually increasing and is currently in the overbought territory, signaling a strong bullish momentum.
- Stochastic Oscillator: Both %K and %D lines of the Stochastic Oscillator are in the overbought zone, indicating a strong bullish momentum.
- Williams %R: The Williams %R is also in the overbought region, further supporting the bullish sentiment.
Volatility Analysis:
- Bollinger Bands: The Bollinger Bands have been narrowing, suggesting decreasing volatility in the stock price.
- Bollinger %B: The %B indicator is hovering around 0.8, indicating that the stock price is closer to the upper band, potentially signaling a bullish trend continuation.
Volume Analysis:
- On-Balance Volume (OBV): The OBV has shown mixed signals, with fluctuations in volume accumulation over the past 5 days.
- Chaikin Money Flow (CMF): The CMF has been negative, indicating some selling pressure in the stock.
Conclusion:
Based on the analysis of the technical indicators, the overall outlook for QRFT stock is bullish in the short term. The trend indicators, momentum oscillators, and volatility signals all point towards a continuation of the current uptrend. However, the mixed signals in volume accumulation suggest some caution.
Key Points:
- Trend: Upward
- Momentum: Strongly Bullish
- Volatility: Decreasing
- Volume: Mixed
Recommendation:
Considering the bullish trend and strong momentum, investors may consider buying QRFT stock for potential short-term gains. However, it is essential to monitor volume movements closely for any shifts in market sentiment. As always, it is advisable to conduct further research and risk assessment before making any investment decisions.