Technical Analysis of QRMI 2024-05-10
Overview:
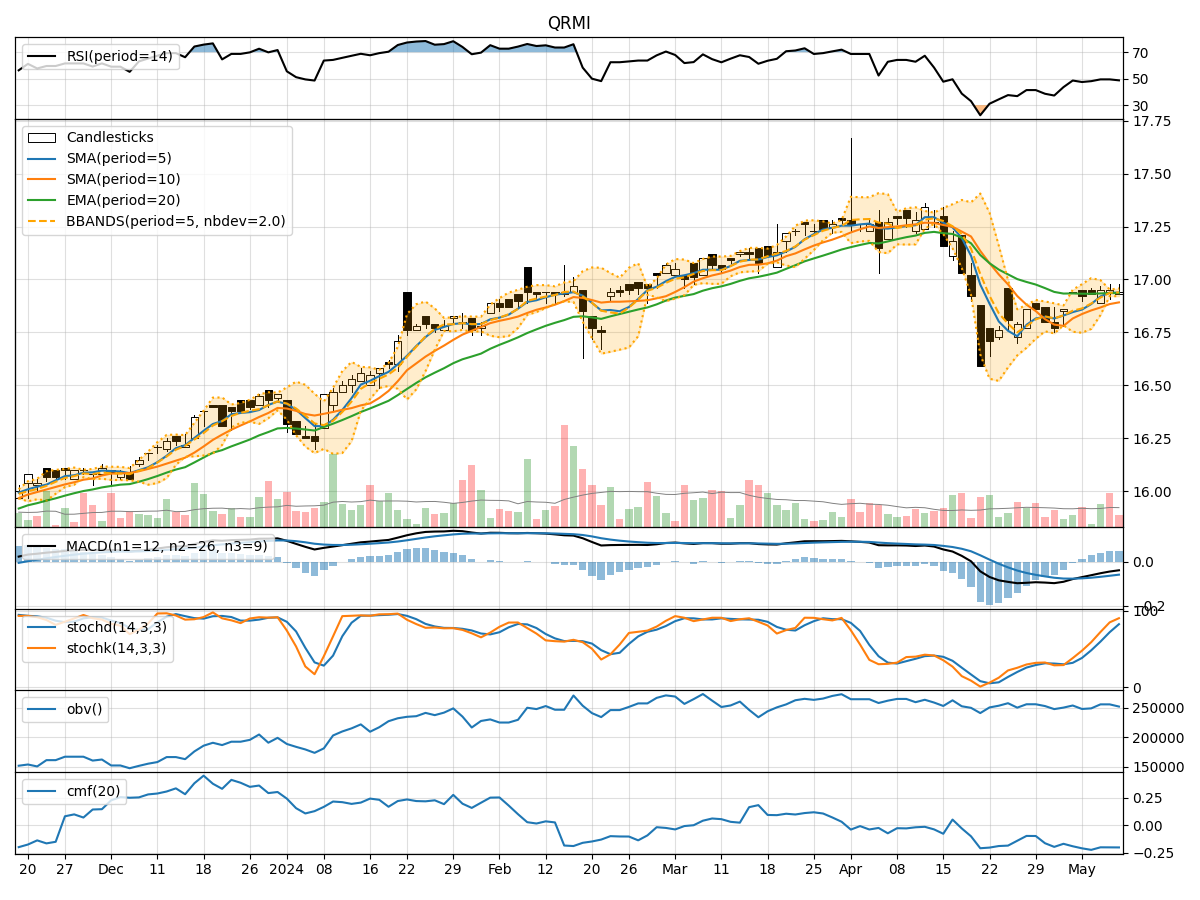
In the last 5 trading days, QRMI stock has shown mixed signals across various technical indicators. The trend indicators suggest a slightly bearish sentiment, with the Moving Average Convergence Divergence (MACD) showing negative values. Momentum indicators like the Relative Strength Index (RSI) and Stochastic Oscillator indicate a neutral to slightly bullish stance. Volatility indicators show a narrowing Bollinger Bands, indicating potential consolidation. Volume indicators suggest a lack of strong buying or selling pressure.
Trend Indicators:
- Moving Averages (MA): The 5-day MA is slightly above the 10-day Simple Moving Average (SMA), indicating short-term bullishness. However, the Exponential Moving Average (EMA) is showing a downward trend, suggesting a possible bearish reversal.
- MACD: The MACD line is negative, indicating a bearish trend. The MACD Histogram is decreasing, signaling weakening bearish momentum.
Momentum Indicators:
- RSI: The RSI is hovering around 50, indicating a neutral stance. It has not shown any extreme overbought or oversold conditions.
- Stochastic Oscillator: Both %K and %D lines of the Stochastic Oscillator are in the overbought zone, suggesting a potential reversal or consolidation.
- Williams %R (Willams %R): The Williams %R is in the oversold territory, indicating a possible buying opportunity.
Volatility Indicators:
- Bollinger Bands (BB): The Bollinger Bands are narrowing, suggesting decreasing volatility and a potential period of consolidation. The bands are close to each other, indicating a lack of significant price movement.
- Bollinger %B (BB %B): The %B is below 1, indicating that the price is trading below the lower Bollinger Band, potentially signaling an oversold condition.
Volume Indicators:
- On-Balance Volume (OBV): The OBV has been relatively flat, indicating a balance between buying and selling pressure. There is no significant accumulation or distribution trend.
- Chaikin Money Flow (CMF): The CMF is negative, suggesting that money is flowing out of the stock. This indicates a lack of strong buying interest.
Conclusion:
Based on the analysis of the technical indicators, the next few days for QRMI stock are likely to see sideways movement or consolidation. The trend indicators show a slightly bearish bias, while momentum indicators are mixed with a slight bullish inclination. Volatility indicators point towards a period of consolidation with decreasing price fluctuations. Volume indicators suggest a lack of significant buying or selling pressure.
Overall, the stock is likely to trade within a narrow range in the near term, with potential for a minor upside if momentum indicators strengthen. However, caution is advised as the trend indicators lean towards a bearish outlook.