Technical Analysis of QSML 2024-05-10
Overview:
In analyzing the technical indicators for QSML over the last 5 days, we will delve into the trend, momentum, volatility, and volume indicators to provide a comprehensive outlook on the possible stock price movement in the coming days. By examining these key indicators, we aim to offer valuable insights and predictions to guide your investment decisions.
Trend Indicators:
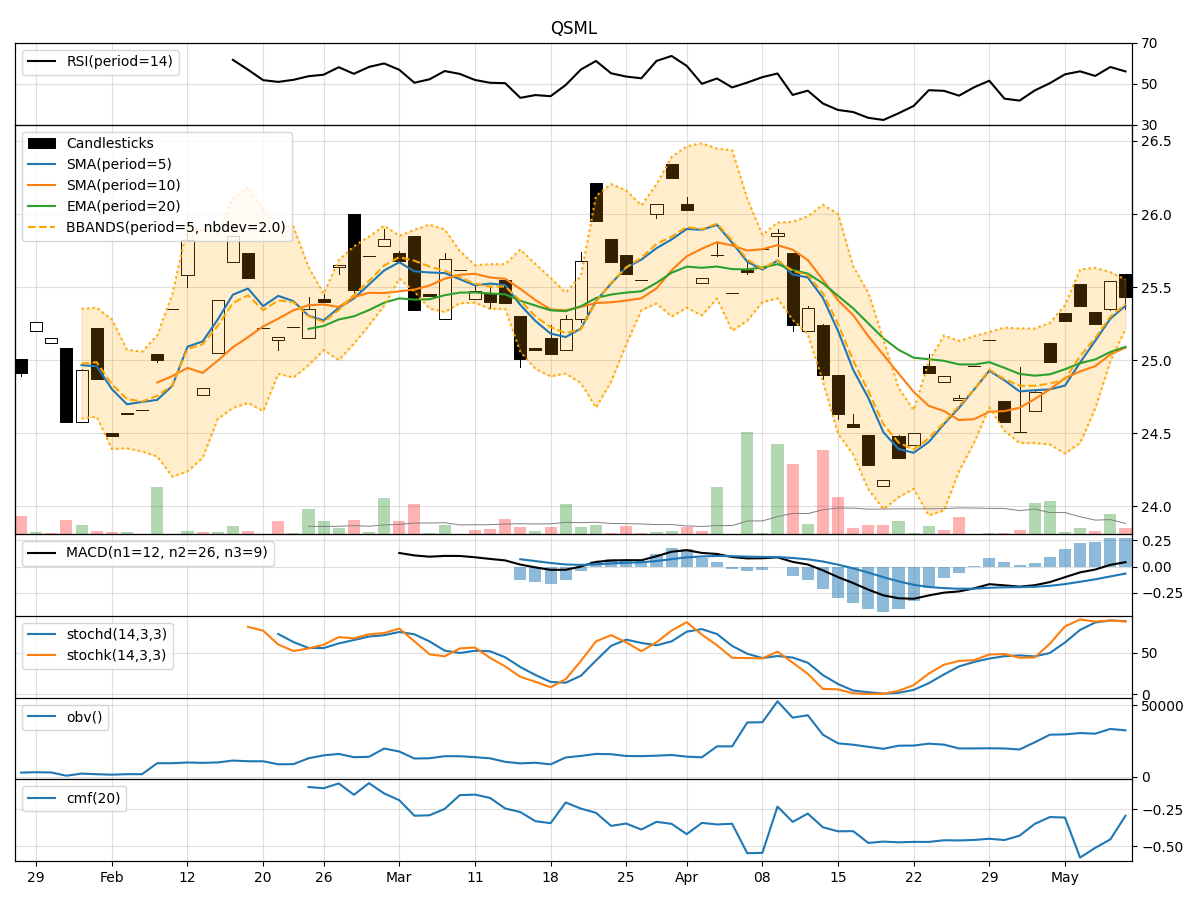
- Moving Averages (MA): The 5-day MA has been consistently above the 10-day SMA, indicating a short-term bullish trend. The EMA(20) has been trending upwards, suggesting positive momentum in the stock price.
- MACD: The MACD line has been above the signal line for the past few days, indicating a bullish trend. The MACD histogram has been increasing, further supporting the bullish momentum.
Momentum Indicators:
- RSI: The RSI has been fluctuating around the 50 level, indicating a neutral stance in momentum. There is no clear overbought or oversold signal.
- Stochastic Oscillator: Both %K and %D lines have been hovering in the overbought territory, suggesting potential for a pullback in the stock price.
- Williams %R: The Williams %R is currently in the oversold region, indicating a potential reversal in the stock price.
Volatility Indicators:
- Bollinger Bands: The stock price has been trading within the Bollinger Bands, with no significant breaches. The bands are relatively narrow, indicating low volatility in the stock.
Volume Indicators:
- On-Balance Volume (OBV): The OBV has been fluctuating, indicating mixed buying and selling pressure. There is no clear trend in volume accumulation.
- Chaikin Money Flow (CMF): The CMF has been negative, suggesting outflow of money from the stock. This indicates bearish sentiment in terms of volume flow.
Key Observations:
- The trend indicators suggest a bullish bias in the short term, supported by the moving averages and MACD.
- Momentum indicators show mixed signals, with RSI neutral, Stochastic overbought, and Williams %R oversold.
- Volatility is low, as indicated by the narrow Bollinger Bands, signaling a period of consolidation.
- Volume indicators reflect mixed sentiment, with OBV fluctuating and CMF indicating bearish volume flow.
Conclusion:
Based on the analysis of the technical indicators, the stock price of QSML is likely to experience sideways consolidation in the coming days. The bullish trend indicated by moving averages and MACD may be limited by the mixed signals from momentum and volume indicators. Low volatility suggests a lack of significant price movements, while volume indicators point to a lack of strong buying or selling pressure. Therefore, the stock is expected to trade within a range with no clear directional bias in the near term.