Technical Analysis of QSWN 2024-05-10
Overview:
In analyzing the technical indicators for QSWN over the last 5 days, we will delve into the trend, momentum, volatility, and volume indicators to provide a comprehensive assessment of the stock's potential price movement. By examining these key factors, we aim to offer valuable insights and predictions for the next few days.
Trend Analysis:
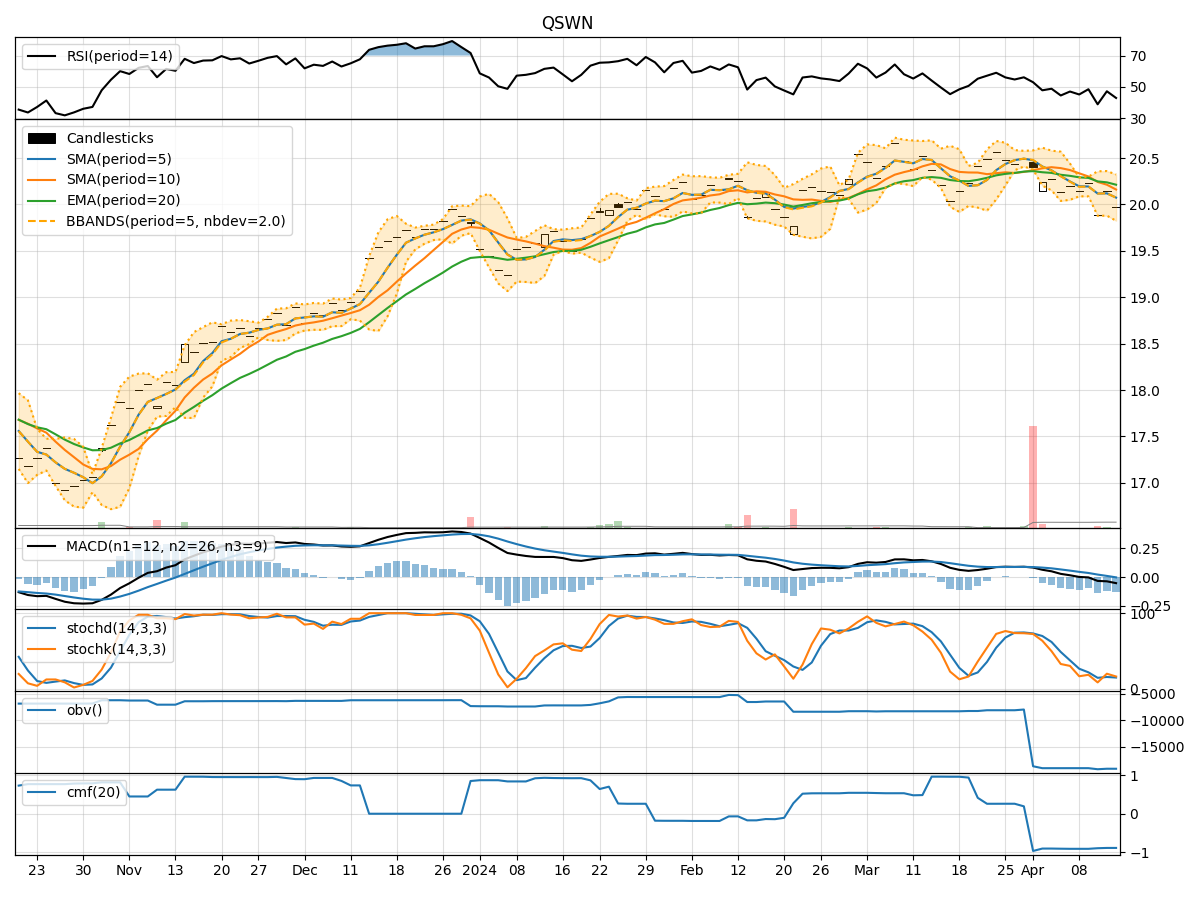
- Moving Averages (MA): The 5-day MA has been consistently above the closing prices, indicating a short-term uptrend.
- MACD: The MACD line has been above the signal line, suggesting bullish momentum.
- RSI: The RSI has been hovering around the neutral zone, indicating a balanced market sentiment.
Key Observation: The trend indicators suggest a bullish bias in the short term.
Momentum Analysis:
- Stochastic Oscillator: Both %K and %D have been relatively high, indicating strong buying pressure.
- Williams %R: The indicator has been fluctuating around the oversold territory, signaling potential buying opportunities.
Key Observation: Momentum indicators point towards a bullish momentum in the stock.
Volatility Analysis:
- Bollinger Bands (BB): The bands have been narrowing, indicating decreasing volatility.
- BB %B: The %B indicator has been relatively stable, suggesting a lack of extreme price movements.
Key Observation: Volatility has been decreasing, potentially leading to a period of consolidation.
Volume Analysis:
- On-Balance Volume (OBV): The OBV has been relatively flat, indicating a balance between buying and selling pressure.
- Chaikin Money Flow (CMF): The CMF has been consistently at 0, suggesting a neutral money flow trend.
Key Observation: Volume indicators reflect a lack of significant accumulation or distribution.
Conclusion:
Based on the analysis of the technical indicators, the next few days for QSWN are likely to see continued upward movement in the stock price. The trend indicators, momentum indicators, and the overall market sentiment all point towards a bullish outlook. However, the decreasing volatility and lack of significant volume movements suggest a possible period of consolidation before potential further upside.
Key Conclusion: Bullish outlook with a potential short-term consolidation phase.
By considering these technical indicators collectively, investors can make more informed decisions regarding their positions in QSWN. It is essential to monitor the evolving market dynamics and adjust strategies accordingly to capitalize on potential opportunities.