Technical Analysis of QTAP 2024-05-10
Overview:
In analyzing the technical indicators for QTAP over the last 5 days, we will delve into the trend, momentum, volatility, and volume indicators to provide a comprehensive outlook on the possible stock price movement in the coming days. By examining these key aspects, we aim to offer valuable insights and predictions to guide your investment decisions.
Trend Indicators:
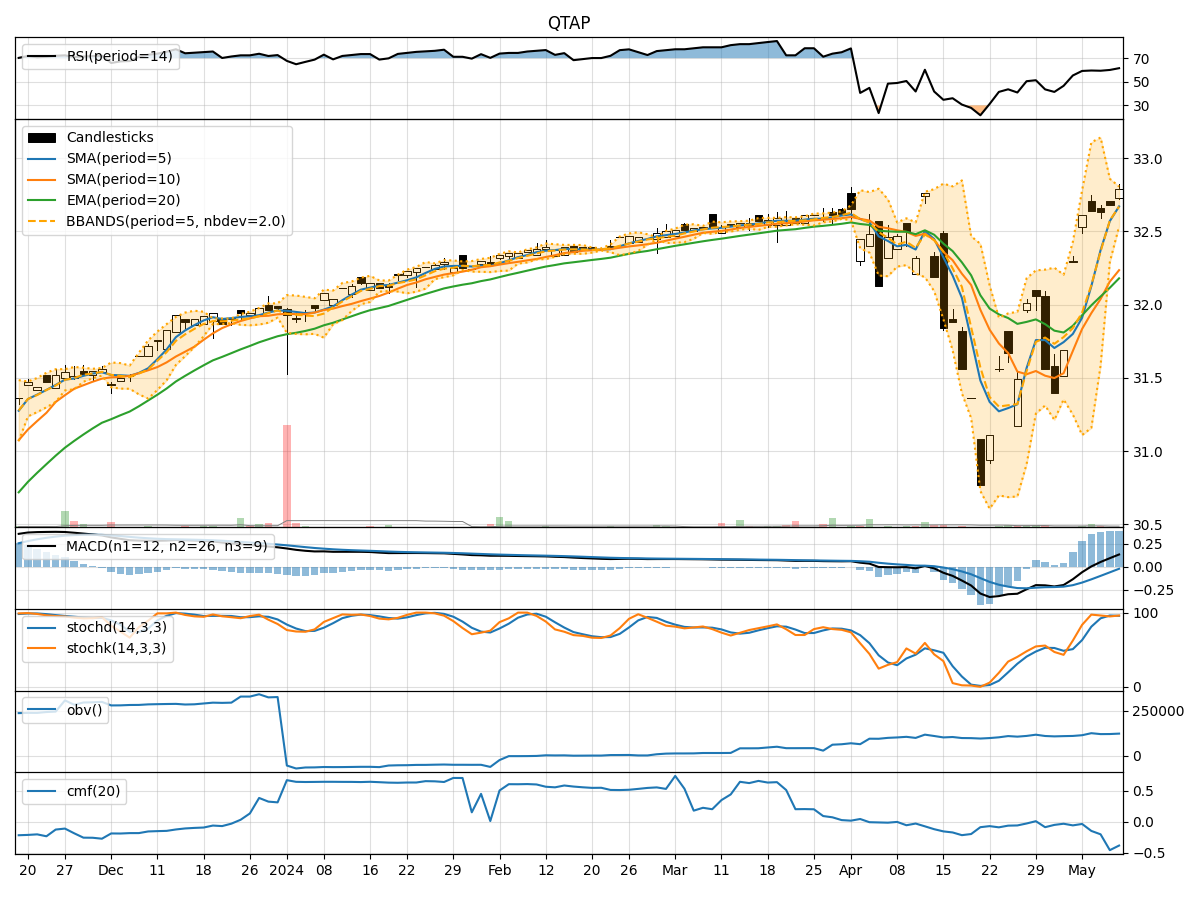
- Moving Averages (MA): The 5-day Moving Average (MA) has been consistently above the Simple Moving Average (SMA) and Exponential Moving Average (EMA), indicating a bullish trend.
- MACD: The Moving Average Convergence Divergence (MACD) has shown positive values, with the MACD line consistently above the Signal line, suggesting bullish momentum.
- Conclusion: The trend indicators point towards an upward movement in the stock price.
Momentum Indicators:
- RSI: The Relative Strength Index (RSI) has been in the neutral to slightly overbought territory, indicating moderate buying pressure.
- Stochastic Oscillator: Both %K and %D have been in the overbought zone, suggesting a potential reversal or consolidation.
- Conclusion: The momentum indicators signal a potential consolidation or reversal in the stock price.
Volatility Indicators:
- Bollinger Bands: The stock price has mostly stayed within the Bollinger Bands, with the bands narrowing, indicating decreasing volatility.
- Conclusion: Volatility is decreasing, suggesting a sideways or consolidation phase in the stock price.
Volume Indicators:
- On-Balance Volume (OBV): The OBV has shown mixed movements, indicating indecision among investors.
- Chaikin Money Flow (CMF): The CMF has been negative, reflecting selling pressure in the stock.
- Conclusion: Volume indicators suggest a lack of strong buying interest and potential bearish sentiment.
Overall Conclusion:
Based on the analysis of trend, momentum, volatility, and volume indicators, the next few days' possible stock price movement for QTAP is likely to be sideways or consolidation with a potential for a bearish bias. Investors should closely monitor key support and resistance levels for potential entry or exit points.
Recommendation:
- Consider implementing risk management strategies to protect against potential downside risks.
- Wait for clearer signals from the indicators before making significant trading decisions.
- Keep a close watch on any news or external factors that could impact the stock price movement.
By combining the insights from various technical indicators, investors can make more informed decisions and navigate the market with greater confidence.