Technical Analysis of QTEC 2024-05-10
Overview:
In analyzing the technical indicators for QTEC over the last 5 days, we will delve into the trend, momentum, volatility, and volume indicators to provide a comprehensive outlook on the possible stock price movement in the coming days. By examining these key aspects, we aim to offer valuable insights and predictions for informed decision-making.
Trend Indicators:
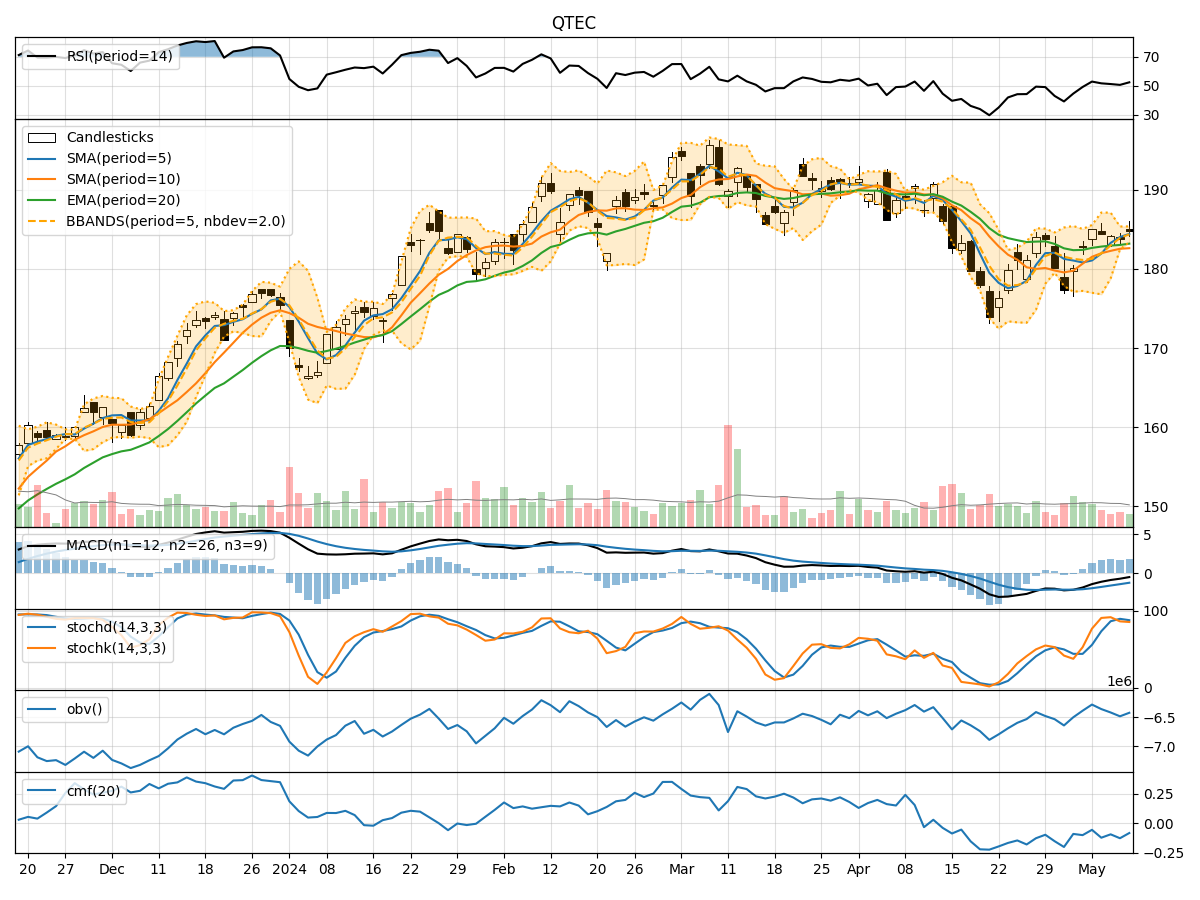
- Moving Averages (MA): The 5-day MA has been consistently above the 10-day SMA, indicating a short-term bullish trend. The EMA(20) has shown a slight upward trend, suggesting positive momentum.
- MACD: The MACD line has been below the signal line, but the gap is narrowing, indicating a potential bullish crossover in the near future.
- MACD Histogram: The histogram has been gradually moving towards the zero line, signaling a possible shift towards bullish momentum.
Momentum Indicators:
- RSI: The RSI has been fluctuating around the neutral zone, indicating indecision in the market.
- Stochastic Oscillator: Both %K and %D have been hovering in the overbought territory, suggesting a potential reversal or consolidation.
- Williams %R: The indicator has been in the oversold region, indicating a possible buying opportunity.
Volatility Indicators:
- Bollinger Bands: The bands have been narrowing, suggesting decreasing volatility and a potential breakout in the near future.
- Bollinger %B: The %B indicator has been fluctuating within a tight range, indicating a period of consolidation.
Volume Indicators:
- On-Balance Volume (OBV): The OBV has been fluctuating, indicating mixed buying and selling pressure.
- Chaikin Money Flow (CMF): The CMF has been negative, suggesting a lack of strong buying interest in the stock.
Key Observations and Opinions:
- Trend: The short-term trend is bullish, supported by the moving averages and MACD indicators.
- Momentum: Momentum indicators show mixed signals, with RSI indicating neutrality and stochastic oscillators suggesting a potential reversal.
- Volatility: Bollinger Bands narrowing indicate a period of low volatility, possibly preceding a breakout.
- Volume: Volume indicators show mixed signals, with OBV fluctuating and CMF indicating a lack of strong buying interest.
Conclusion:
Based on the analysis of the technical indicators, the next few days for QTEC could see sideways consolidation with a slight bullish bias. Traders should watch for a potential breakout as volatility increases, while also monitoring momentum indicators for confirmation of a sustained trend. It is advisable to exercise caution and wait for clearer signals before making significant trading decisions.