Technical Analysis of QTJL 2024-05-10
Overview:
In analyzing the technical indicators for QTJL stock over the last 5 days, we will delve into the trend, momentum, volatility, and volume indicators to provide a comprehensive outlook on the possible stock price movement in the coming days. By examining these key indicators, we aim to offer valuable insights and predictions for potential investors.
Trend Analysis:
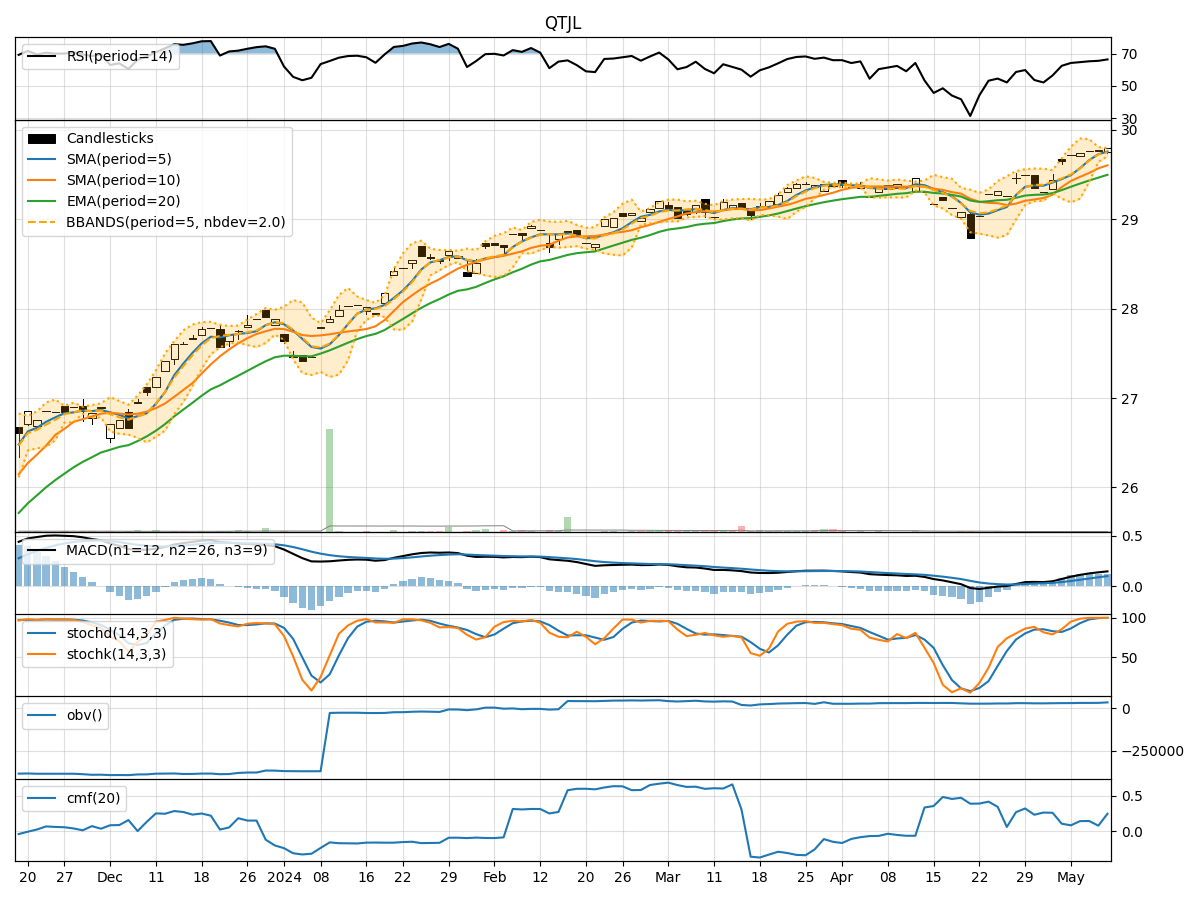
- Moving Averages (MA): The 5-day MA has been consistently above the closing price, indicating a bullish trend.
- MACD: The MACD line has been steadily increasing, with the MACD histogram also showing positive values, suggesting a strengthening bullish momentum.
Key Observation: The trend indicators point towards an upward trend in the stock price.
Momentum Analysis:
- RSI: The RSI has been gradually increasing and is in the overbought territory, signaling strong buying momentum.
- Stochastic Oscillator: Both %K and %D have reached 100%, indicating a strong bullish momentum.
Key Observation: The momentum indicators suggest a bullish sentiment in the market.
Volatility Analysis:
- Bollinger Bands (BB): The stock price has been trading within the upper Bollinger Band, indicating high volatility.
Key Observation: Volatility is high, which may lead to significant price movements.
Volume Analysis:
- On-Balance Volume (OBV): The OBV has been steadily increasing, reflecting higher buying volume.
- Chaikin Money Flow (CMF): The CMF is positive, indicating money flow into the stock.
Key Observation: The volume indicators suggest positive buying pressure in the stock.
Conclusion:
Based on the analysis of trend, momentum, volatility, and volume indicators, the overall outlook for QTJL stock is bullish. The stock is likely to experience further upward movement in the coming days. Investors may consider buying positions in anticipation of potential price appreciation.
Key Points:
- Trend: Upward trend indicated by moving averages and MACD.
- Momentum: Strong buying momentum shown by RSI and Stochastic Oscillator.
- Volatility: High volatility suggests potential price swings.
- Volume: Increasing OBV and positive CMF indicate buying interest.
Recommendation:
Considering the bullish signals across all indicators, it is advisable to consider long positions in QTJL stock. However, it is essential to monitor the market closely and set appropriate stop-loss levels to manage risk effectively.