Technical Analysis of QTOC 2024-05-10
Overview:
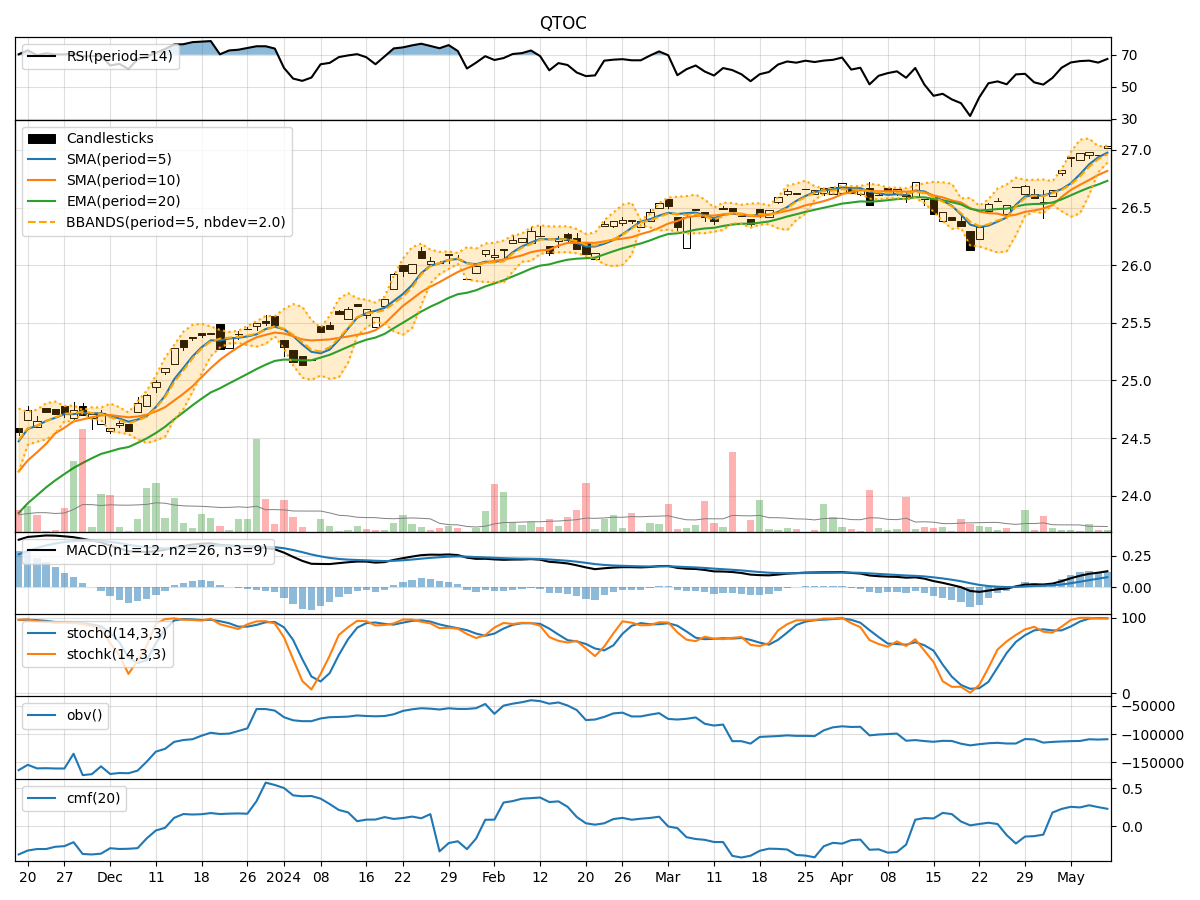
In analyzing the technical indicators for QTOC over the last 5 days, we will delve into the trend, momentum, volatility, and volume indicators to provide a comprehensive outlook on the possible stock price movement in the coming days. By examining these key indicators, we aim to offer valuable insights and predictions for potential investors.
Trend Indicators:
- Moving Averages (MA): The 5-day Moving Average (MA) has been consistently above the Simple Moving Average (SMA) and Exponential Moving Average (EMA), indicating a bullish trend.
- MACD: The MACD line has been consistently above the signal line, suggesting positive momentum in the stock price.
- MACD Histogram: The MACD Histogram has been increasing, indicating strengthening bullish momentum.
Momentum Indicators:
- RSI: The Relative Strength Index (RSI) has been in the overbought territory, suggesting a potential pullback in the stock price.
- Stochastic Oscillator: Both %K and %D have been in the overbought zone, indicating a possible reversal in the short term.
- Williams %R: The Williams %R is also in the oversold region, signaling a potential downward movement.
Volatility Indicators:
- Bollinger Bands: The stock price has been trading within the Bollinger Bands, with the bands narrowing, indicating reduced volatility.
- Bollinger %B: The %B indicator is hovering around 1, suggesting the stock price is at the upper band, potentially indicating an overbought condition.
Volume Indicators:
- On-Balance Volume (OBV): The OBV has been fluctuating but has not shown a clear trend, indicating mixed sentiment among investors.
- Chaikin Money Flow (CMF): The CMF has been positive, suggesting buying pressure in the stock.
Key Observations and Opinions:
- Trend: The stock is currently in an upward trend based on moving averages and MACD analysis.
- Momentum: Momentum indicators like RSI and Stochastic Oscillator suggest a potential pullback or reversal in the short term.
- Volatility: Volatility has been decreasing, indicating a possible period of consolidation.
- Volume: Volume indicators show mixed signals, with OBV not confirming the price movement.
Conclusion:
Based on the analysis of the technical indicators, the next few days' possible stock price movement for QTOC is likely to experience a short-term pullback or consolidation after the recent bullish trend. Investors should exercise caution and consider potential profit-taking opportunities in the near future. It is advisable to closely monitor key support and resistance levels for better decision-making.