Technical Analysis of QUAL 2024-05-10
Overview:
In analyzing the technical indicators for the stock QUAL over the last 5 days, we will delve into the trends, momentum, volatility, and volume indicators to provide a comprehensive outlook on the possible stock price movement in the coming days. By examining these key indicators, we aim to offer valuable insights and recommendations for potential investors.
Trend Indicators:
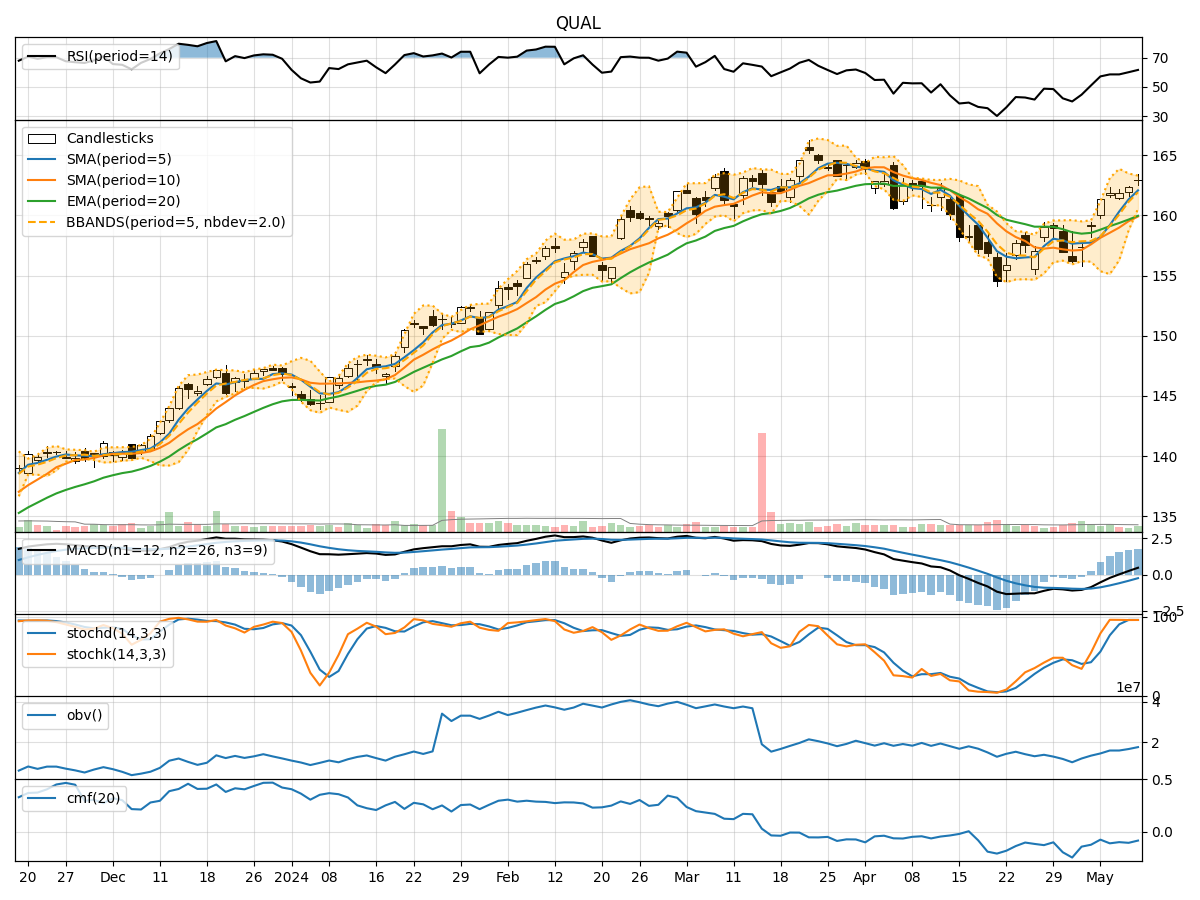
- Moving Averages (MA): The 5-day moving average has been consistently rising, indicating a bullish trend in the short term.
- MACD: The MACD line has been increasing, showing positive momentum in the stock's price movement.
- RSI: The Relative Strength Index has been trending upwards, suggesting increasing buying pressure.
Momentum Indicators:
- Stochastic Oscillator: Both %K and %D have been at high levels, indicating overbought conditions.
- Williams %R: The Williams %R is in the oversold territory, suggesting a potential reversal in the stock's price.
Volatility Indicators:
- Bollinger Bands: The stock price has been trading within the upper Bollinger Band, indicating a period of high volatility.
- Average True Range (ATR): The ATR has been relatively stable, suggesting consistent price movements.
Volume Indicators:
- On-Balance Volume (OBV): The OBV has been declining, indicating selling pressure in the stock.
- Chaikin Money Flow (CMF): The CMF has been negative, suggesting outflow of money from the stock.
Key Observations and Opinions:
- Trend: The stock is in an upward trend based on the moving averages and MACD.
- Momentum: The stock is currently overbought according to the Stochastic Oscillator, which may lead to a potential pullback.
- Volatility: The stock is experiencing high volatility as indicated by the Bollinger Bands.
- Volume: The declining OBV and negative CMF suggest bearish sentiment in the stock.
Conclusion:
Based on the analysis of the technical indicators, the next few days' possible stock price movement for QUAL is likely to experience a short-term pullback or consolidation. The stock may face resistance at the upper Bollinger Band levels due to overbought conditions and selling pressure indicated by the volume indicators. Investors should exercise caution and consider waiting for a better entry point before considering long positions.