Technical Analysis of QULL 2024-05-10
Overview:
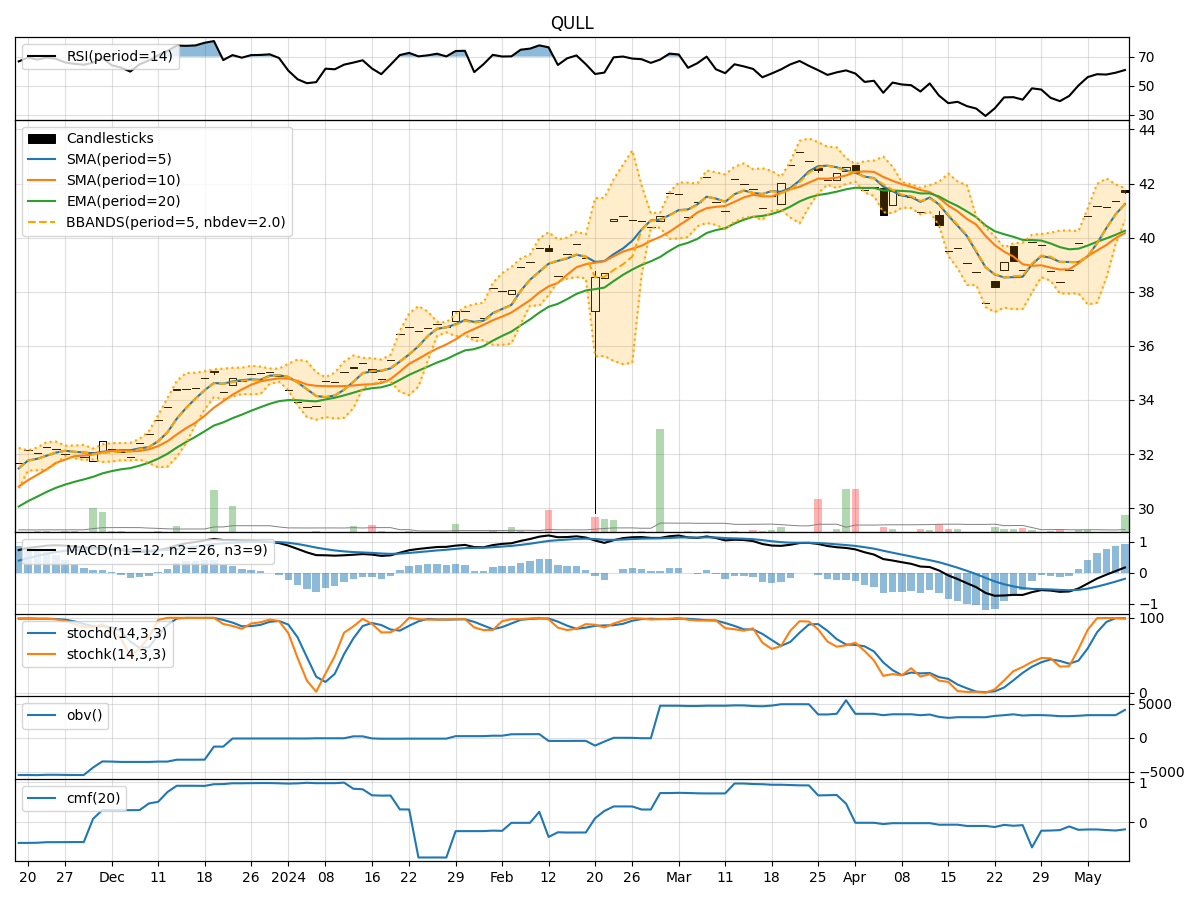
In analyzing the technical indicators for QULL over the last 5 days, we will delve into the trend, momentum, volatility, and volume indicators to provide a comprehensive outlook on the possible stock price movement in the coming days. By examining these key aspects, we aim to offer valuable insights and predictions for potential investors.
Trend Indicators:
- Moving Averages (MA): The 5-day MA has been consistently rising, indicating a bullish trend in the short term.
- MACD: The MACD line has been positive and increasing, suggesting upward momentum.
- RSI: The RSI has been gradually increasing, reflecting strengthening buying pressure.
Momentum Indicators:
- Stochastic Oscillator: Both %K and %D have been at high levels, signaling overbought conditions.
- Williams %R: The indicator has been in oversold territory, potentially indicating a reversal.
Volatility Indicators:
- Bollinger Bands (BB): The bands have been widening, indicating increased volatility.
- BB %B: The %B has been fluctuating within a range, suggesting potential price reversals.
Volume Indicators:
- On-Balance Volume (OBV): The OBV has been increasing, indicating accumulation by investors.
- Chaikin Money Flow (CMF): The CMF has been negative, signaling potential selling pressure.
Key Observations:
- The trend indicators suggest a bullish sentiment in the short term.
- Momentum indicators indicate potential overbought conditions, which may lead to a price correction.
- Volatility indicators show increasing price fluctuations, which could result in sharp movements.
- Volume indicators reflect mixed signals, with OBV showing accumulation but CMF indicating selling pressure.
Conclusion:
Based on the analysis of the technical indicators, the next few days' possible stock price movement for QULL is likely to be sideways with a slight bearish bias. While the trend remains bullish in the short term, the overbought conditions indicated by momentum indicators and the mixed signals from volume indicators suggest a potential price correction or consolidation. Traders should exercise caution and consider implementing risk management strategies to navigate the expected market dynamics.