Technical Analysis of QUS 2024-05-10
Overview:
In analyzing the technical indicators for the last 5 days of QUS stock, we will delve into the trend, momentum, volatility, and volume indicators to provide a comprehensive outlook on the possible stock price movement in the upcoming days. By examining these key indicators, we aim to offer valuable insights and predictions to guide investment decisions.
Trend Indicators:
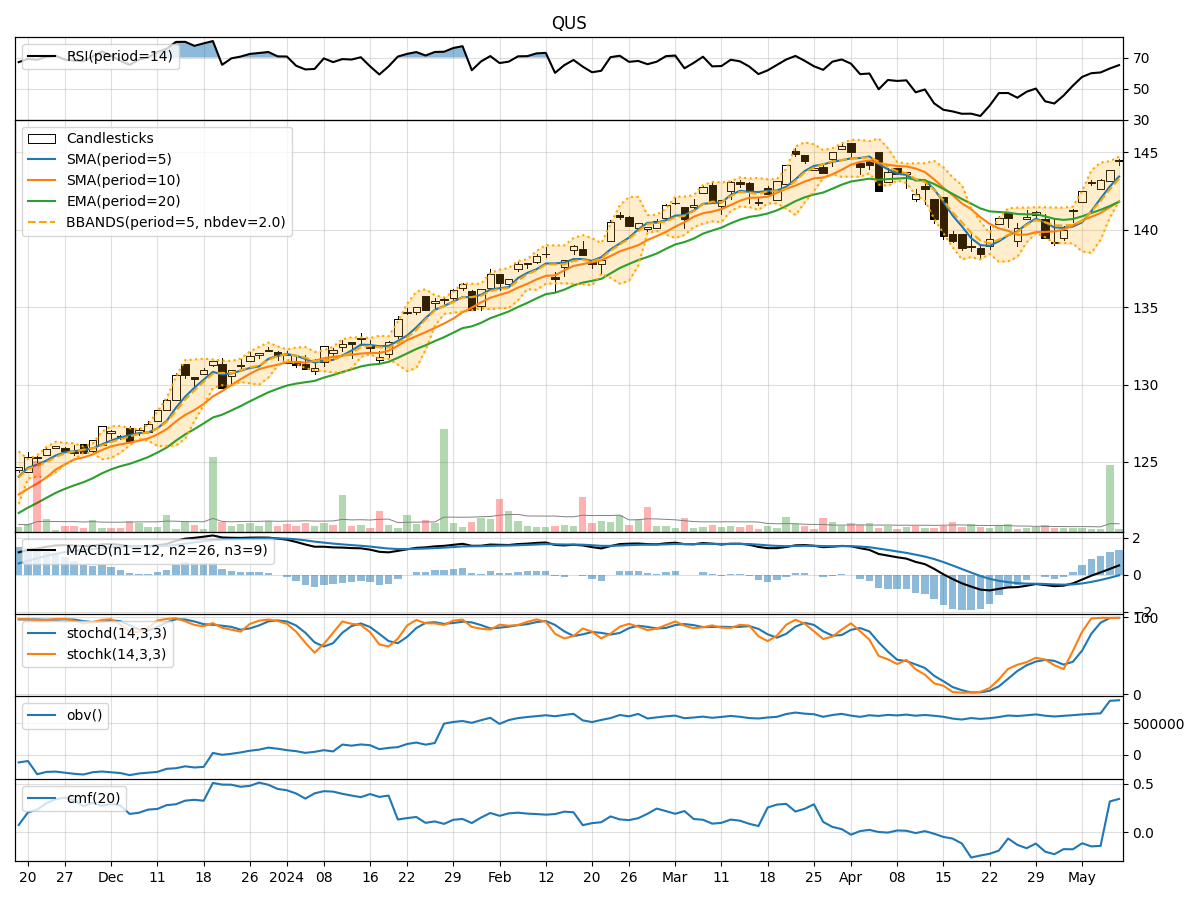
- Moving Averages (MA): The 5-day MA has been consistently rising, indicating a bullish trend in the short term.
- MACD: The MACD line has been above the signal line for the past 5 days, suggesting a bullish momentum.
- EMA: The EMA has been steadily increasing, supporting the bullish trend.
Key Observation: The trend indicators point towards a bullish outlook for QUS stock.
Momentum Indicators:
- RSI: The RSI has been increasing and is currently in the overbought territory, signaling strong buying momentum.
- Stochastic Oscillator: Both %K and %D have been high, indicating an overbought condition.
- Williams %R: The indicator has been fluctuating but remains in the oversold region.
Key Observation: Momentum indicators suggest that the stock is currently overbought and may face a potential pullback.
Volatility Indicators:
- Bollinger Bands (BB): The stock price has been trading within the upper Bollinger Band, indicating high volatility.
- Bollinger Band Width: The band width has been narrowing, suggesting a potential decrease in volatility.
Key Observation: Volatility indicators imply that the stock may experience a decrease in volatility in the near term.
Volume Indicators:
- On-Balance Volume (OBV): The OBV has been increasing, reflecting strong buying pressure.
- Chaikin Money Flow (CMF): The CMF has been positive, indicating money flow into the stock.
Key Observation: Volume indicators signal positive accumulation and buying interest in QUS stock.
Conclusion:
Based on the analysis of trend, momentum, volatility, and volume indicators, the overall outlook for QUS stock in the next few days is as follows: - Trend: Bullish - Momentum: Overbought, potential pullback - Volatility: Decreasing volatility - Volume: Positive accumulation
Recommendation:
Considering the bullish trend and positive volume accumulation, investors may consider buying QUS stock for potential short-term gains. However, given the overbought momentum and decreasing volatility, it is advisable to exercise caution and monitor the stock closely for any signs of a pullback.