Technical Analysis of QUVU 2024-05-10
Overview:
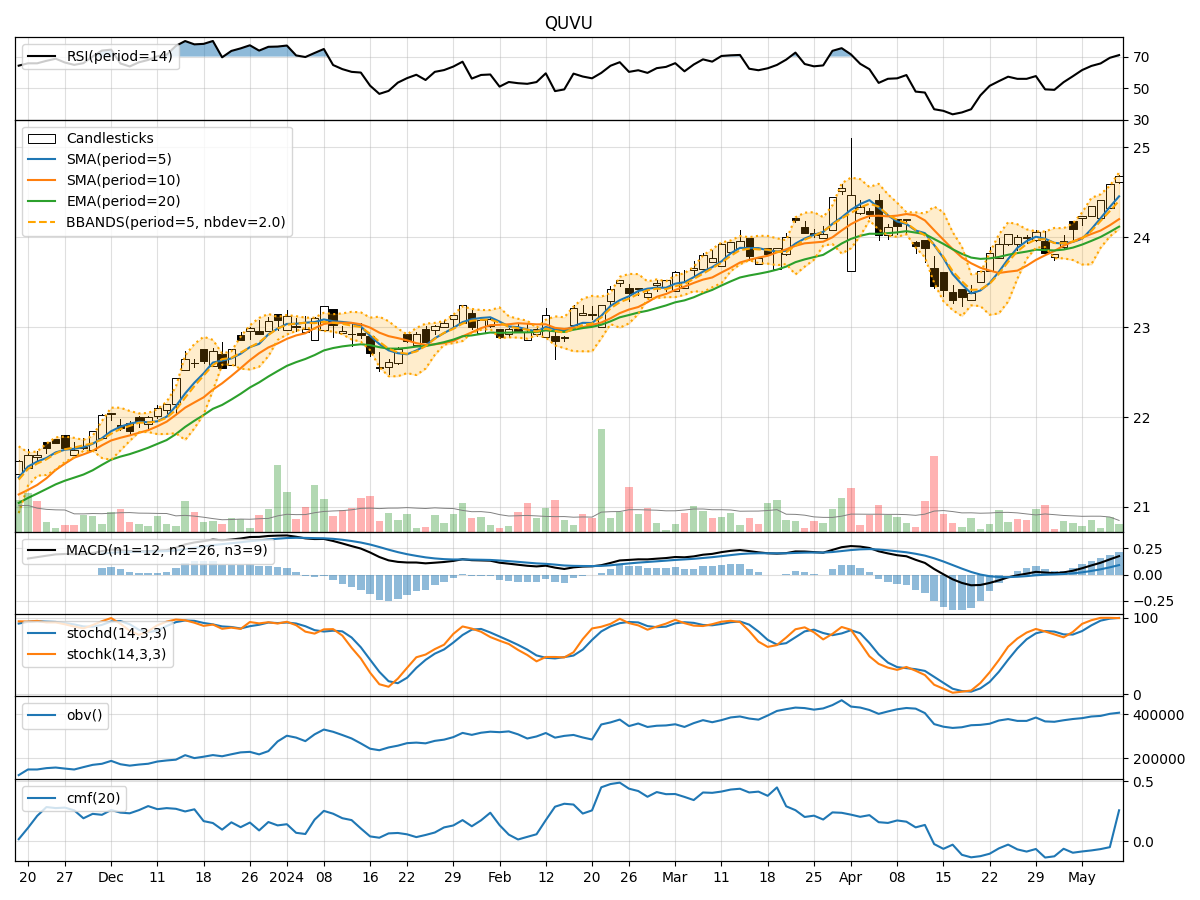
In analyzing the technical indicators for QUVU stock over the last 5 days, we will delve into the trends, momentum, volatility, and volume indicators to provide insights into the possible future stock price movements. By examining these indicators, we aim to offer a comprehensive analysis and make informed predictions for the upcoming days.
Trend Indicators:
- Moving Averages (MA): The 5-day Moving Average (MA) has been consistently rising, indicating a bullish trend in the short term.
- MACD: The MACD line has been increasing, staying above the signal line, suggesting a bullish momentum.
- EMA: The Exponential Moving Average (EMA) has been trending upwards, supporting the bullish sentiment in the stock.
Momentum Indicators:
- RSI: The Relative Strength Index (RSI) has been increasing and is in the overbought territory, signaling a strong bullish momentum.
- Stochastic Oscillator: Both %K and %D have been near or at 100, indicating a strong bullish momentum.
- Williams %R: The Williams %R is in the oversold region, suggesting a potential reversal or consolidation.
Volatility Indicators:
- Bollinger Bands: The stock price has been trading within the upper Bollinger Band, indicating an overbought condition.
- Bollinger %B: The %B indicator is above 0.8, suggesting a potential pullback or consolidation.
- Average True Range (ATR): The ATR has been relatively stable, indicating consistent volatility levels.
Volume Indicators:
- On-Balance Volume (OBV): The OBV has been increasing, indicating strong buying pressure in the stock.
- Chaikin Money Flow (CMF): The CMF has been negative but improving, suggesting a potential shift towards buying pressure.
Key Observations:
- The stock is currently in a strong bullish trend based on moving averages and MACD.
- Momentum indicators like RSI and Stochastic Oscillator signal overbought conditions, indicating a potential pullback or consolidation.
- Volatility indicators suggest the stock is overbought and may experience a period of consolidation or a minor correction.
- Volume indicators show increasing buying pressure, supporting the bullish bias in the stock.
Conclusion:
Based on the analysis of the technical indicators, the next few days for QUVU stock are likely to see a potential pullback or consolidation after the recent strong bullish momentum. Traders should be cautious of the overbought conditions indicated by momentum indicators and the upper Bollinger Band. It would be prudent to wait for a potential dip or consolidation phase before considering new long positions.