Technical Analysis of QVAL 2024-05-10
Overview:
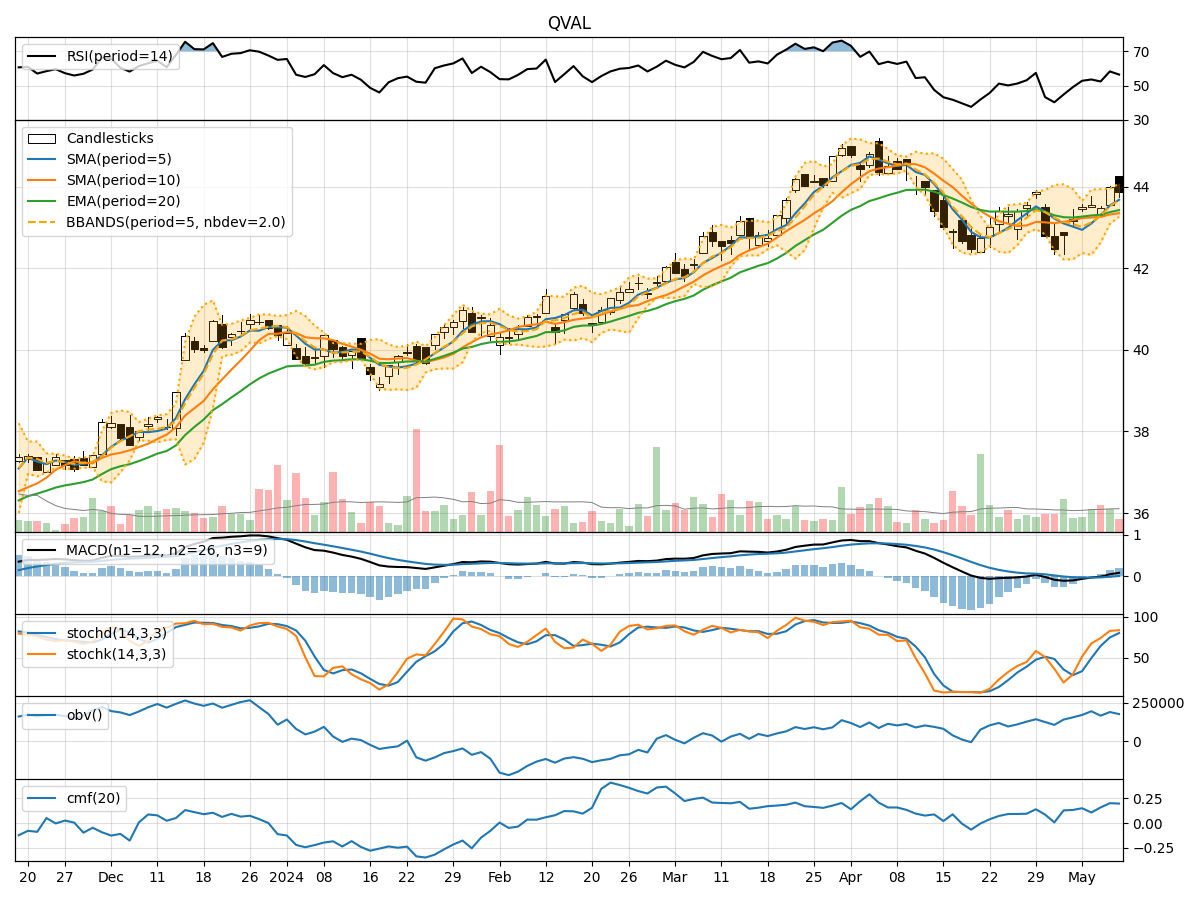
In analyzing the technical indicators for QVAL over the last 5 days, we will delve into the trend, momentum, volatility, and volume indicators to provide a comprehensive outlook on the possible stock price movement in the coming days.
Trend Analysis:
- Moving Averages (MA): The 5-day MA has been trending slightly above the closing prices, indicating a short-term uptrend.
- MACD: The MACD line has been consistently positive, with the MACD histogram showing an increasing positive momentum.
- EMA: The EMA has been steadily rising, reflecting a bullish sentiment in the stock.
Momentum Analysis:
- RSI: The RSI has been fluctuating around the neutral zone, suggesting a balanced momentum.
- Stochastic Oscillator: Both %K and %D have been in the overbought territory, indicating a potential reversal in the short term.
- Williams %R: The indicator has been hovering in the oversold region, signaling a possible buying opportunity.
Volatility Analysis:
- Bollinger Bands (BB): The stock price has been trading within the bands, indicating a period of consolidation.
- BB %B: The %B indicator has been fluctuating around the midline, suggesting a lack of clear direction in price movement.
Volume Analysis:
- On-Balance Volume (OBV): The OBV has shown mixed signals, reflecting indecision among market participants.
- Chaikin Money Flow (CMF): The CMF has been positive, indicating some buying pressure in the stock.
Key Observations:
- The trend indicators suggest a bullish sentiment in the short term.
- Momentum indicators show a mixed picture with potential for a reversal.
- Volatility indicators point towards a period of consolidation.
- Volume indicators reflect indecision among investors.
Conclusion:
Based on the analysis of the technical indicators, the stock price of QVAL is likely to experience sideways movement in the coming days. The bullish trend indicated by moving averages and MACD may be counteracted by the overbought conditions in the stochastic oscillator and the lack of clear direction in volatility indicators. Investors should exercise caution and wait for further confirmation before making significant trading decisions.